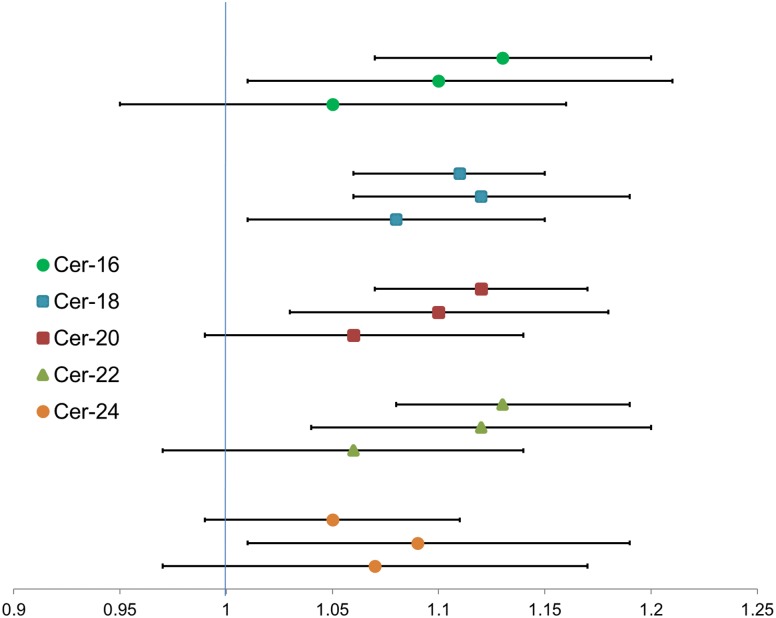
Figure 2.
Association of plasma ceramides with plasma fasting insulin and change in plasma fasting insulin. Shown is the ratio of insulin geometric means associated with twofold higher ceramide. Within each ceramide, top estimate represents the association with insulin at baseline, middle estimate the association with insulin at follow-up, and bottom estimate the association with change in insulin between baseline and follow-up.

