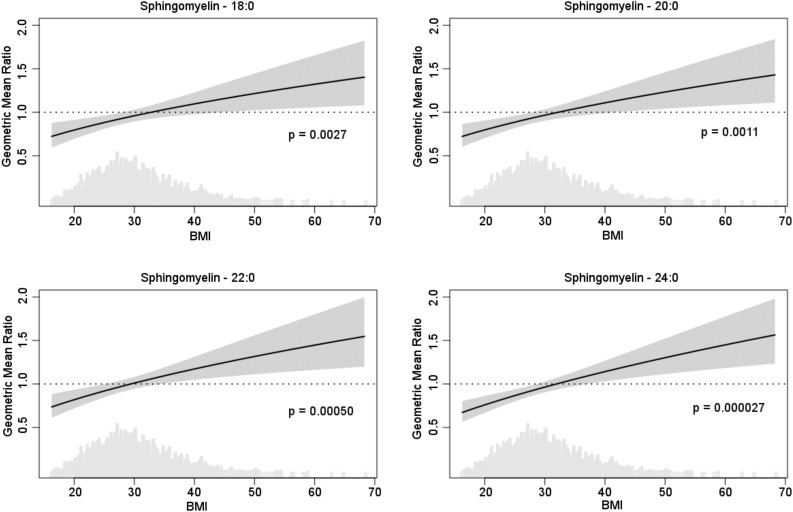
Figure 3.
Geometric mean ratio of insulin levels associated with twofold difference in sphingomyelin species as a function of BMI (kg/m2). Each plot shows the ratio of baseline insulin geometric means associated with twofold higher sphingomyelin species as a function of BMI (solid line) and 95% CI (shaded area). A geometric mean ratio of 1.0 indicates no association. Values less than 1 indicate an association with lower insulin, and values above 1 indicate an association with higher insulin. The density plot shows the distribution of BMI values in the cohort.

