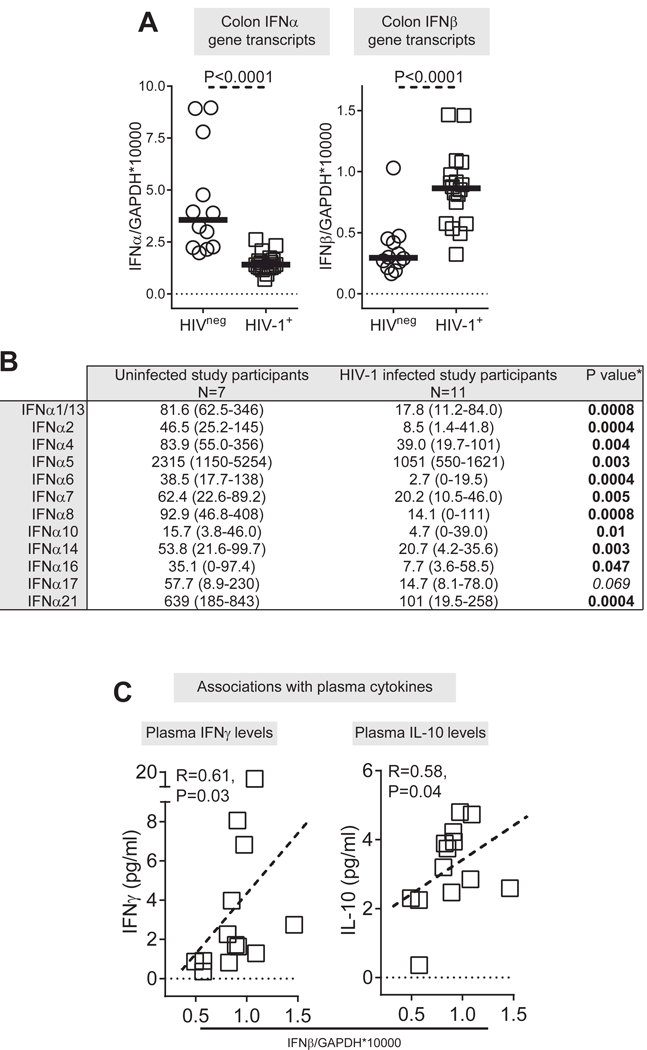
Figure 2. IFNα/β gene transcript levels in colonic cells in untreated, chronically infected HIV-1 and uninfected study participants.

(A) Levels of IFNα/β gene transcripts were measured in colonic samples from HIV-1 uninfected (HIVneg; n=12) and untreated, chronic HIV-1 infected (HIV-1+; n=18) study participants. Lines represent median values. (B) Expression of IFNα subtypes (number of transcripts for each IFNα subtype relative to total IFNα gene transcripts) in colonic samples were assessed in 18 HIV-infected and 8 uninfected study participants. *Bold font indicates a significant p value. Italics indicates a trend (P<0.1). (C) Correlations between IFNβ gene transcript levels and plasma levels of IFNγ and IL-10 in HIV-1 infected study participants (n=13; Plasma levels of IFNγ and IL-10 were not evaluated in 5 of the study participants with IFNβ gene expression data). Dotted line is a visual representation of the significant association. Statistical analysis was performed using the Mann-Whitney test to determine differences between unmatched group and Spearman test to determine correlations between variables.
