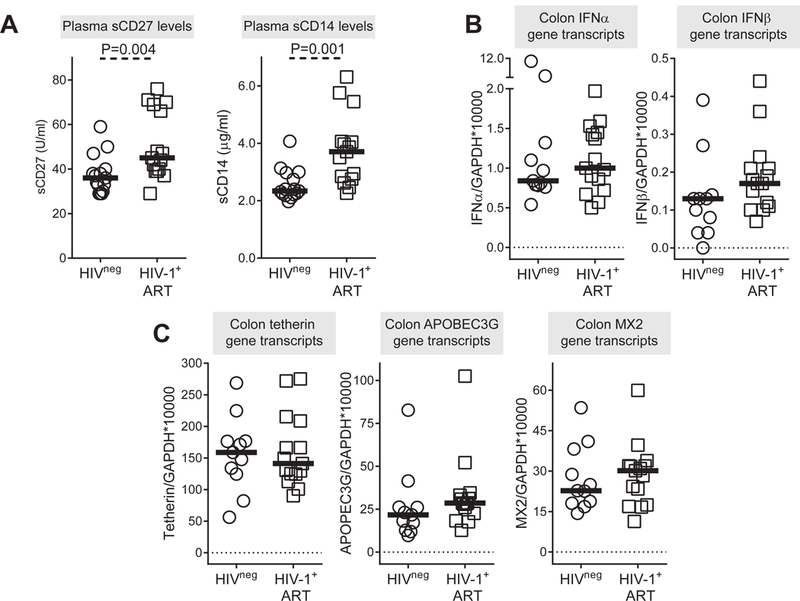
Figure 4. Restriction factor gene transcript levels in colonic cells in treated, chronically infected HIV-1 and uninfected study participants.

(A) Plasma levels of sCD27 and sCD14 in HIV-1 uninfected (HIVneg; n=15) and anti-retroviral therapy (ART) treated HIV-1 infected (HIV-1+ ART; n=15) study participants. Levels of (B) IFNα/β gene transcripts and (C) tetherin (BST2), APOBEC3G and MX2 gene transcripts measured in colonic tissue samples from HIV-1 uninfected (HIVneg; n=11) and ART treated HIV-1 infected (HIV-1+ ART; n=15) study participants. Lines represent median values. Statistical analysis was performed using the Mann-Whitney test to determine differences between unmatched groups.
