
Fig. 5.
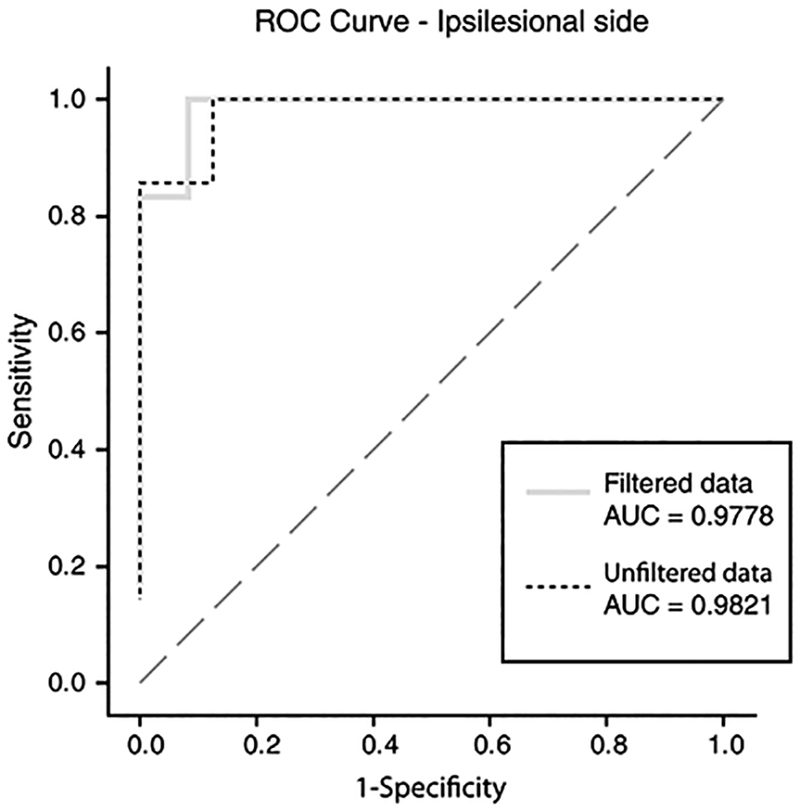
ROC curves demonstrating sensitivity and specificity for stroke, comparing unfiltered to filtered results. This receiver operating characteristic (ROC) curve analysis plots the diagnostic accuracy (sensitivity and specificity) of quantitative VOG-derived VOR mean gains for identifying PICA stroke in AVS. We used ipsilesional vestibular neuritis and PICA stroke gains for ROC analysis and to determine an optimal VOR gain cut point for discrimination. The diagonal line indicates a hypothetical useless diagnostic test with a likelihood ratio of 1.0 at all diagnostic threshold cut points. The dashed line illustrates the ROC curve derived from unfiltered data from the VOG device, while the grey line shows the ROC curve from filtered data. Total diagnostic accuracy for stroke diagnosis at all thresholds, as measured by the area under the curve (AUC), is effectively identical for unfiltered vs. filtered results.