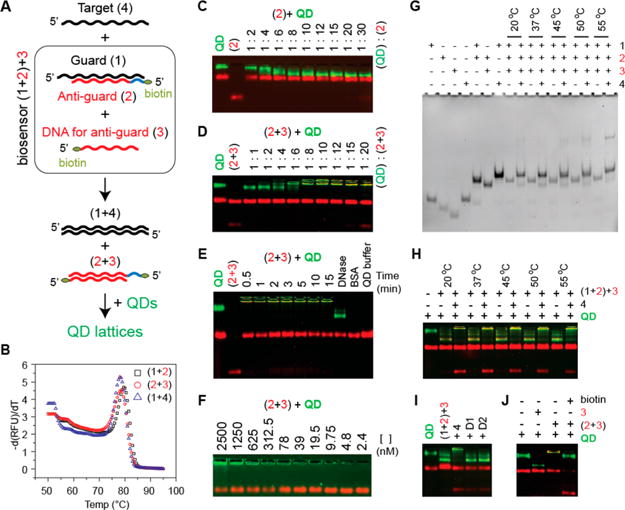
Figure 3.

Recognition of target nucleic acids by programmable biosensor. A: Schematics explaining the working principle of biosensor and nomenclature. B: Melting temperatures measured for all duplexes participating in biosensing. C: Titration experiments carried out to determine the highest number of biotinylated DNAs to be bound to QDs. D: Titration experiments carried out to determine the ratio of double biotinylated (2 + 3) duplexes to QDs required for lattice formation. E: Time course of QD lattice formation and treatment of QD lattices with DNase. Red bands on all agarose gels stained with EtBr appear due to composition of the QD buffer that contains BSA. F: Series of dilutions of QD lattices performed in QD buffer. G: Total EtBr staining native-PAGE showing the strands displacement and biosensor activation (formation of 2 + 3) upon the presence of target strand (4). DNA for anti-guard strand (3) is the shortest and appears dim in (1 + 2) + 3 lanes; however, the formation of (2 + 3) duplexes is well observed in the following lanes. H: Target strand triggered formation of QD lattices analyzed with agarose gel. For (G,H), different incubation temperatures were tested. I: Target-specific formation of QD lattices is promoted by target (4) and not by “dummy” strands (D1 or D2). J: The formation of QD lattices is blocked in the presence of free biotin.
