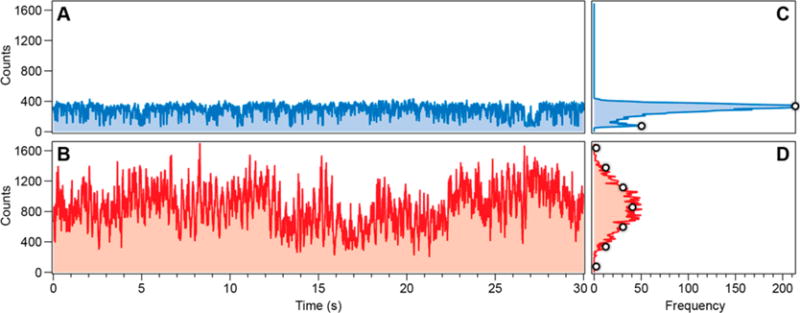
Figure 5.

Representative blinking traces. A: Recorded on a bright spot in a fluorescence image from QDs incubated with biosensor (1:10 ratio). B: Recorded from a bright spot from QDs plus biosensor after incubation with target strands. Corresponding intensity histograms are shown in C and D. The white dots in D are derived from the two white intensity markers in C using a binomial model described in the text.
