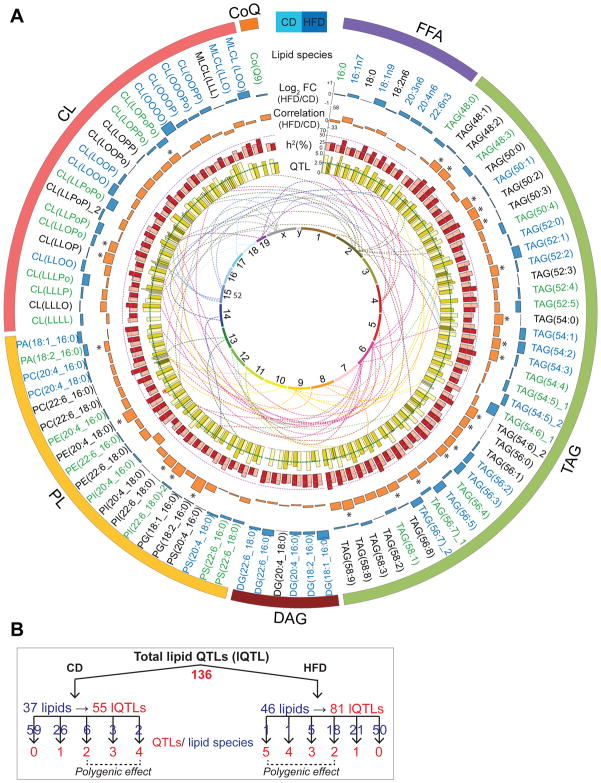
Figure 3. Genetics of lipid species.
(A) Circos plot of all lipids measured. Blue bars in the outermost ring represent the log2 fold change (HFD vs. CD) of the lipids. Lipids increased in CD or HFD are shown in green and blue font respectively. Orange bars represent the correlation of lipids between CD and HFD. Significant correlations (adj. p-value<0.05) are represented by “*”. Red bars represent lipid h2 in CD (light red) and HFD (dark red). The inner ring of yellow bars represents the strength of lQTLs in CD (light yellow) and HFD (dark yellow). Number of bars per lipid is equivalent to the number of lQTLs. The lines between the two innermost rings stem from the peak lQTL bar (with LOD > 3) and terminates on their approximate chromosomal position of the innermost ring. Lipid pairs marked with “_1” and “_2” (TAGs 54:5, 54:6, 56:7; PI(Dha_S) and CL(LLOPo)) indicate two isobaric peaks. (B) Schematic representation of the lQTLs. 136 lQTLs (55 CD and 81 HFD) were mapped from 37/46 lipids in CD/HFD. The number of QTLs (red font) per lipid species (blue font) is indicated. See also Figure S3 and Tables S3–S5.

