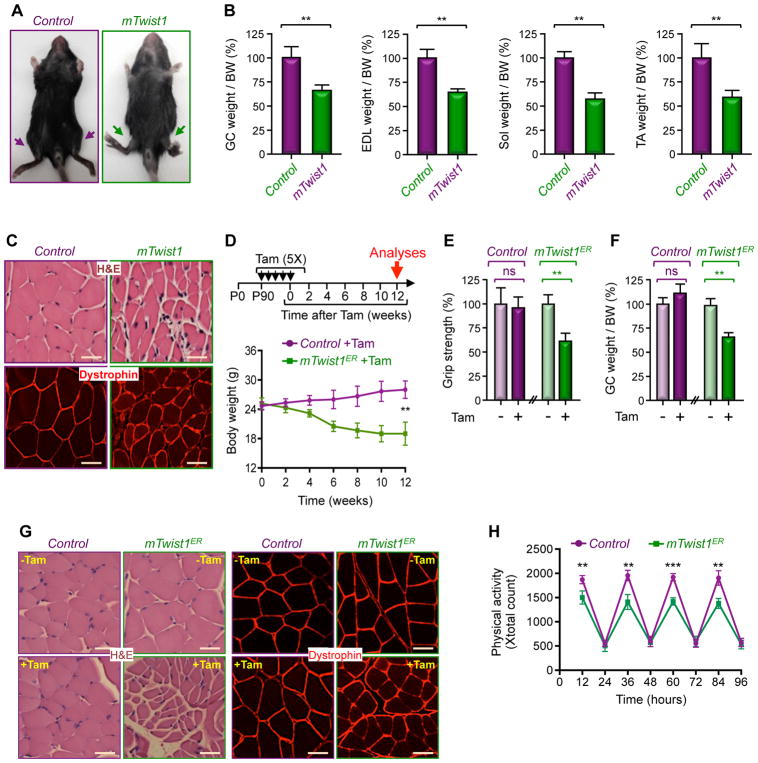
Figure 1. Twist1 Overexpression Drives Muscle Atrophy.
(A) Representative pictures of two-month-old mTwist1 and control mice.
(B) The weights of GC, EDL, Sol, and TA muscles from two-month-old mTwist1 and control mice were normalized by body weight (BW) (n= 6).
(C) Analysis of GC muscle cross-sectional areas in two-month-old mTwist1 and control mice by H&E staining or dystrophin immunostaining. Scale bars: 50 μM.
(D–H) Three-month-old mTwist1ER or control mice were injected with vehicle or Tam as indicated (n= 12). Body weight was measured every other week (D). Grip strength (E), GC muscle weight per BW (F), and GC muscle cross-sectional areas (G) were analyzed 12 weeks following treatment. Physical activity was monitored by CLAMS beginning at 12 weeks following treatment (H). Scale bars: 50 μM.
Data in B, D, E, F, and H are expressed as mean ± SEM. **p < 0.01; ***p< 0.001; ns, not significant. See also Figure S1.

