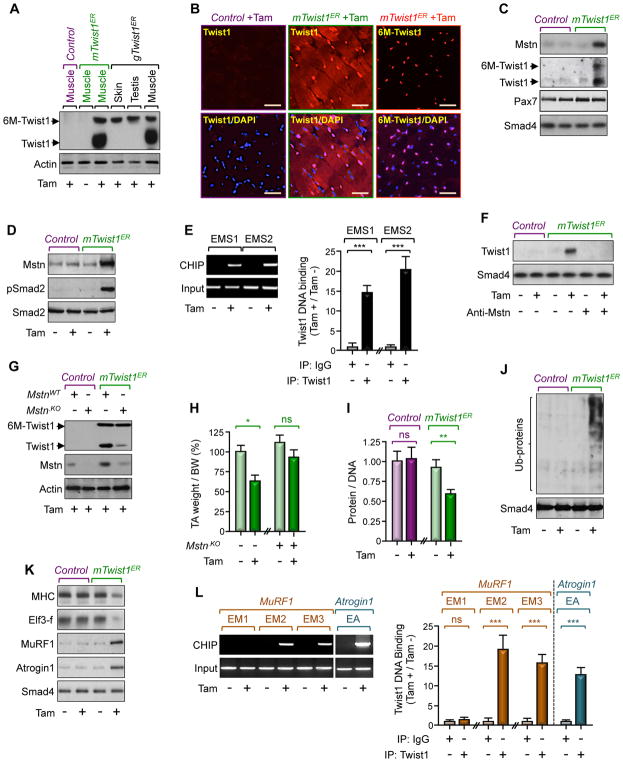
Figure 2. Twist1 Induces Muscle Atrophy.
(A and B) Three-month-old mTwist1ER, gTwist1ER, or control mice were treated with Tam and analyzed for Twist1 expression 12 weeks following treatment. Twist1 expression in hindlimb muscles, skin, or testis was analyzed by immunoblotting using anti-Twist1 antibody (A). GC muscle sections from mTwist1ER or control mice were immunostained with anti-Twist1 or anti-Myc antibody to detect endogenous Twist1 or exogenous 6xMyc-Twist1 (6M-Twist1), respectively (B). Scale bars: 50 μM.
(C) Three-month-old mTwist1ER or control mice were treated with vehicle or Tam and satellite cells were isolated 12 weeks following treatment (n= 6). Expression of Mstn, Pax7, and Twist1 in isolated satellite cells was analyzed by immunoblotting.
(D and E) Three-month-old mTwist1ER or control mice were treated with vehicle or Tam and muscles were analyzed 12 weeks following treatment. Mstn expression and Smad2 phosphorylation were assessed by immunoblotting (D). Twist1 bound to the Mstn promoter was analyzed by ChIP and agarose gel (E).
(F) Myofibers from 3-month-old wild-type mice were cultured in conditioned media of satellite cells from 3-month-old Tam-treated mTwist1ER or control mice in the presence or absence of a neutralizing Mstn antibody. Expression of Twist1 was analyzed by immunoblotting.
(G and H) Muscle of 3-month-old mTwist1ER or control mice were injected with lentiviruses encoding control or gRNA targeting Mstn and then treated with Tam (n= 6). Expression of muscle Twist1 and Mstn was analyzed by immunoblotting 12 weeks following treatment. The weight of TA muscle was normalized by BW (H).
(I–L) Three-month-old mTwist1ER or control mice were treated with vehicle or Tam and muscles were analyzed 12 weeks following treatment (n= 8). The protein/DNA ratio was determined by quantifying total protein and DNA (I). Global protein ubiquitination was analyzed by immunoblotting using an anti-ubiquitin antibody (J). Expression of muscle wasting markers was analyzed by immunoblotting (K). Twist1 bound to the MuRF1 or Atrogin1 promoter was analyzed by ChIP and agarose gel (L).
Data in E, H, I, and L are expressed as mean ± SEM. **p < 0.01; ***p< 0.001; ns, not significant. See also Figure S2.

