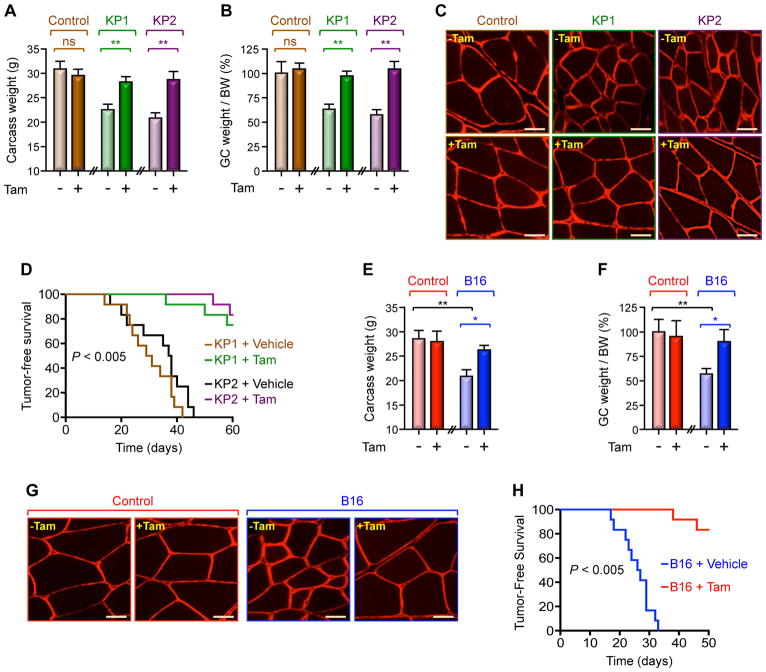
Figure 4. Twist1 Mediates Cancer-Induced Muscle Cachexia.
(A–D) Three-month-old mTwist1KO;ER mice were treated with vehicle or Tam and then inoculated with KP1 or KP2 cells. Carcass weight (calculated by subtracting tumor weight from the total weight) (A), GC muscle weight per BW (B), and GC muscle cross-sectional areas (C) were measured 30 day following cell inoculation (n= 6). Kaplan Meier survival analysis was conducted using 12 mice for each group. p< 0.005 by log-rank test for significance (D). Scale bars: 25 μM.
(E–H) Three-month-old mTwist1KO;ER mice were treated with vehicle or Tam and then inoculated with B16 cells (n= 6). Carcass weight (E), GC weight per BW (F), and GC muscle cross-sectional areas (G) were examined 21 days following cell inoculation. Kaplan-Meier survival analysis was conducted using 12 mice for each group. p< 0.005 by log-rank test for significance (H). Scale bars: 25 μM.
Data in A, B, E, and F are expressed as mean ± SEM. *p < 0.05; **p < 0.01; ns, not significant. See also Figure S4.

