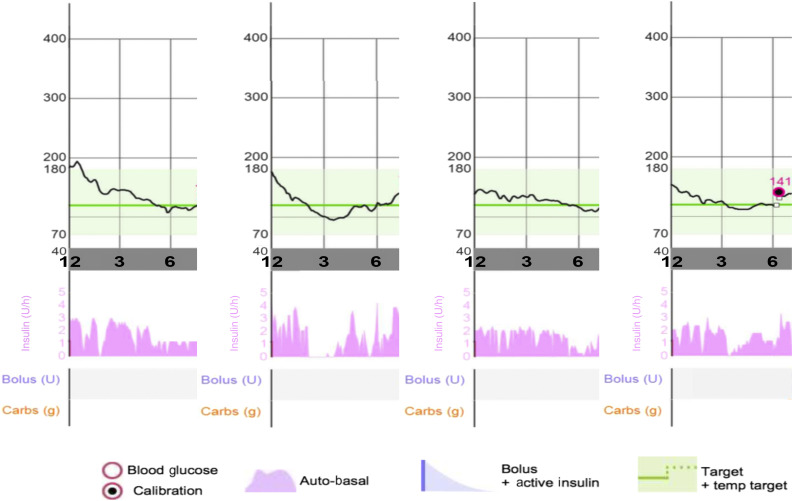
Figure 1.
Four nights (12 a.m.–7 a.m.) in a single patient using the 670G system. In each panel, sensor glucose tracing is represented as the black line, with the system set point of 120 mg/dL (6.7 mmol/L) denoted by the solid green line. The target range of 70–180 mg/dL (3.9–10 mmol/L) is shaded in light green. The lower panel displays in pink the variable automated basal insulin delivery (Auto-basal) that is driven by the sensor glucose values. Carbs, carbohydrates; temp, temporary; U, units.

