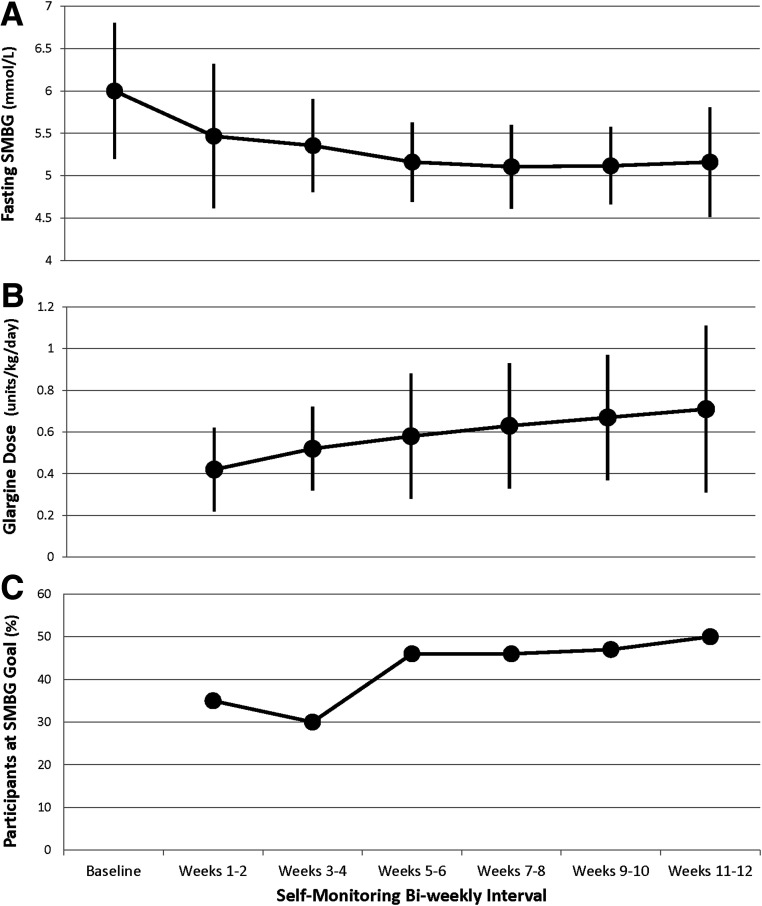
Figure 1.
Insulin doses and corresponding fasting glucose values over time while on glargine treatment. A: Mean fasting morning SMBG values every 2 weeks over 12 weeks. B: Mean glargine dose corresponding to each SMBG value. C: Corresponding percentage of participants who achieved the goal fasting SMBG of 4.4–5.0 mmol/L every 2 weeks. Data are mean (95% CI).

