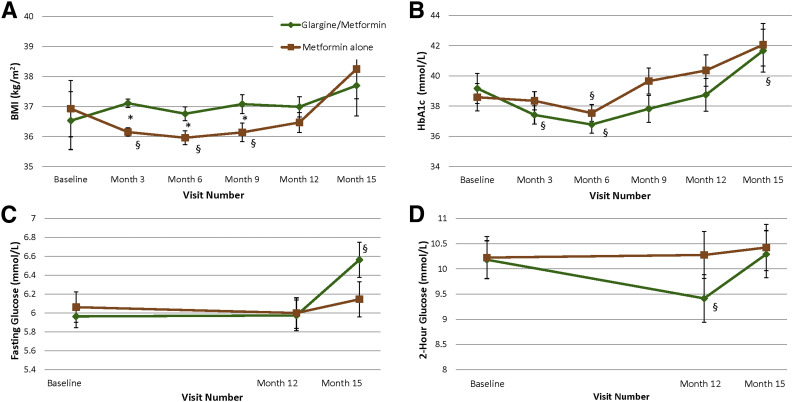
Figure 4.
BMI and glycemia over time. BMI (A), HbA1c (B), fasting glucose (C), and OGTT 2-h glucose over 15 months (D). In the glargine followed by metformin group (n = 44 [green]), glargine insulin was given from baseline to 3 months followed by metformin from months 3 through 12. In the metformin alone group (n = 47 [brown]), metformin was given from baseline through 12 months. Treatment was discontinued in both groups at 12 months. Data are mean ± SEM. *P < 0.05 for the difference between treatment groups at the specified time point; §P < 0.05 for the difference within treatment group between the specified time point and baseline.

