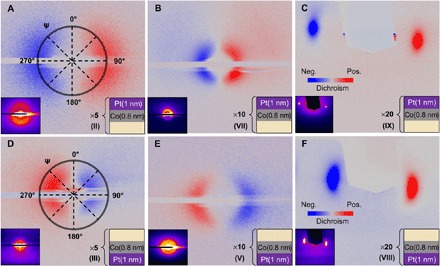
Fig. 2. CD-XRMS analysis of different multilayer stacking configurations.

Multilayers with D < 0 and (A) 5 repetitions (sample II), (B) 10 repetitions (sample VII), and (C) 20 repetitions (sample IX) and with D > 0 and (D) 5 repetitions (sample III), (E) 10 repetitions (sample V), and (F) 20 repetitions (sample VIII). The dichroism is normalized for each image and indicated by the color scale from blue (negative) to red (positive). Left insets are the corresponding sum [circularly left (CL) + circularly right (CR)] images evidencing the magnetic distribution ordering. Right insets present schemes of the studied stackings.
