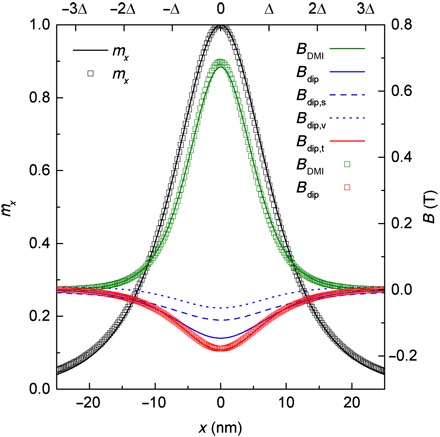
Fig. 3. DW profile (black, left scale) and analytical model for estimation of DMI (green, right scale) and dipolar (red, right scale) fields for the top layer of (III) [Pt(1)/Co(0.8)/Ir(1)]5.

The squares are the result of micromagnetic minimization of the energy, while the lines are the fields obtained from the model. The dashed and dotted blue lines are, respectively, surface and volume charge contributions to the interaction dipolar field (solid blue line). The red line is the total dipolar field from the model (obtained by adding the intralayer demagnetizing field to the interlayer interaction dipolar field). The parameter Δ has been adjusted for the magnetization arctan analytical profile to fit the micromagnetic profile.
