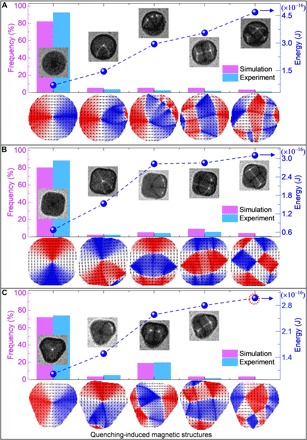
Fig. 3. Comparison of micromagnetic simulations with experimental observations.

(A to C) Simulation results of the occurrence frequency distribution and energies of the femtosecond laser pulse (fluence of 12 mJ/cm2)–induced magnetic structures in circular, square, and triangular Py disks, respectively. The bottom panel in each subfigure shows the typical results of possible magnetic structures obtained by the micromagnetic simulations (pink bars). The corresponding experiment-determined occurrence frequency distribution of the femtosecond laser pulse–induced magnetic structures is also plotted in blue bars for comparison. The simulation results reproduce the experimental results well (the statistical errors of the histograms are below 5%), with the exception of one magnetic structure in the triangle disk [indicated by the dashed red circle in (C)].
