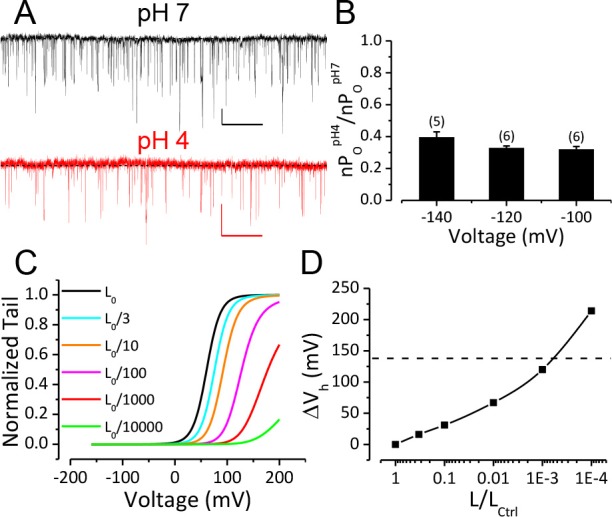
Figure 2. Reduction of BK C-O equilibrium constant L only accounts for a small portion of observed gating shift by extracellular acidification.

(A) BK single channel activity recorded from an outside-out patch held at −100 mV perfusing in solutions at pH 7 or pH 4. 10 μM Ca2+ was included in pipette solution. Opening is downward. The nPO of the trace at pH 7 is 0.067. The nPO of the trace at pH 4 is 0.03. Scale bars: 10 pA vertical, 50 ms horizontal. (B) Fractional nPO of BK channels when pHO is changed from 7 to 4 at three negative holding potentials (−100, −120, −140 mV). The number of patches obtained at each potential is listed above each column. There is no significant difference among values determined at these three holding potentials (p>0.05, one-way ANOVA). (C) G-V curves calculated using the H-A model with published parameters: Kd = 11 μM, C = 8, D = 24, E = 2.4, L0 = 10−6, VhC = 156 mV, zj = 0.58 e, zl = 0.3 e (Horrigan and Aldrich, 2002) to highlight the potential impact of changes in L0 (zero voltage C-O equilibrium constant). L0 is scaled down from the published value of 10−6 (black line, L0ctrl) to shift the G-V toward positive potentials. Vh is shifted by +16 mV when L0 is reduced to 0.33 × 10⁻⁶ (cyan line, L0ctrl/3). (D) Change of Vh plotted against fold-reduction in L0. The data points are connected by a cubic spline line with no physical meaning. Dotted line marks the change of Vh observed in our experiment when pHO was changed from 7 to 4.
