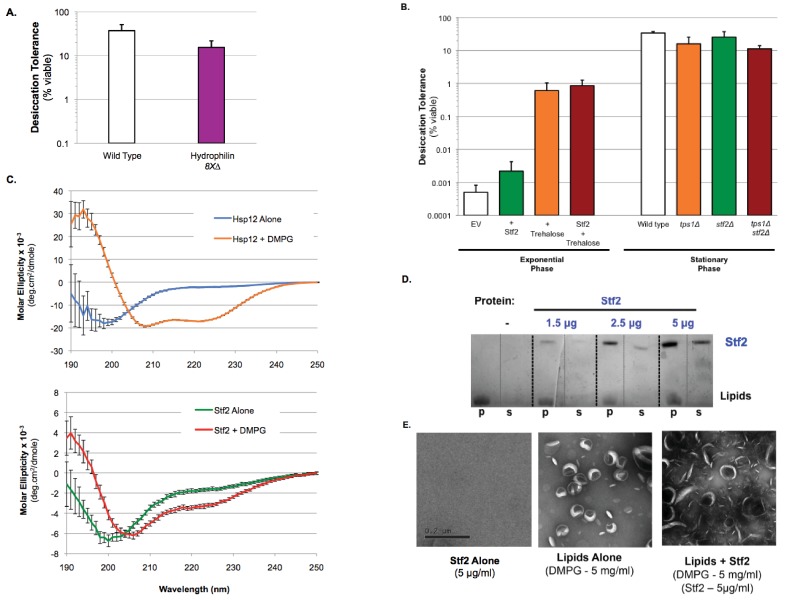
Figure 5. Desiccation protection not a common hydrophilin feature.
(A) Yeast cells were grown to saturation (5 days), air-dried for 2 days at 23°C, 60% relative humidity (RH), then rehydrated and assessed for viability by counting colony forming units (CFU). Desiccation tolerance of wild type vs. 8X∆: hsp12∆ gre1∆ sip18∆ stf2∆ nop6∆ ybr016w∆ yjl144w∆ ynl190w∆ cells. (B) Exponential Phase. Yeast cells (nth1∆, AGT1+) were grown to mid-exponential phase (OD <0.5) in rich media (YPD). Cells were then transferred to either rich media (YPD, 0% trehalose) or rich media with trehalose (YPD, 2% trehalose) for 1 hr. Cells were collected, washed, and air dried for 2 d at 23°C, 60% relative humidity (RH), then rehydrated and assessed for viability by counting colony forming units (CFU). Stationary Phase. Yeast cells are ± AGT1 (trehalose transporter) and ± Stf2 (over-expression from 2μ plasmid, GPD promoter). Yeast cells were grown to saturation (5 days), air-dried for 2 days at 23°C, 60% relative humidity (RH), then rehydrated and assessed for viability by counting colony forming units (CFU). Desiccation tolerance of wild type, tps1∆, stf2∆ and tps1∆stf2∆ cells. (C) Circular dichroism spectroscopy performed on 0.32 mg/ml Hsp12 or 0.32 mg/ml of Stf2 in the presence or absence of 1.2 mg/ml DMPG small unilamellar vesicles (SUVs), measuring from 250 to 190 nm. Units converted to Mean Molar Residue Ellipticity, accounting for concentration and protein size. (D) DMPG liposomes (5 mg/ml) where incubated for 1 hr at room temperature in the presence or absence of Stf2 (1.5–5 μg/ml). Pellet (p) and supernatant (s) fractions where separated by high-speed centrifugation, lipid distribution was assessed by SDS-PAGE followed by altered Coomassie staining (10% acetic acid only). (D) Samples for electron microscopy where the same as in A, with Stf2 at 5 μg/ml. Images where taken from samples prior to centrifugation. Samples where spread on glow-discharged EM grids and stained using 2% uranyl acetate.


