. 2018 Jun 22;7:e34843. doi: 10.7554/eLife.34843

Figure 1. ERp5 triggers αIIbβ3 integrin de-adhesion from fibrinogen.

(A) ERp5 does not induce αIIbβ3 integrin activation on platelets, or influence integrin activation by ADP. The activated αIIbβ3 is measured by PAC-1 antibody binding. The data points and errors (1 SD) are from measurements of four different healthy donor platelets. (B–D) Platelet adhesion to fibrinogen under flow is impaired by ERp5. Part B are representative images of platelet adhesion to immobilized fibrinogen in the absence of presence of 2 µM ERp5. Parts C and D are kinetics of platelet adhesion to fibrinogen in the absence or presence of 2 µM ERp5 at fluid shear rates of 1000 s−1 or 3000 s−1, respectively. The data points and errors (1 SD) are from three measurements each from three different healthy donor platelets. *p<0.05, ****p<0.001; assessed by unpaired, two-tailed Student’s t-test.

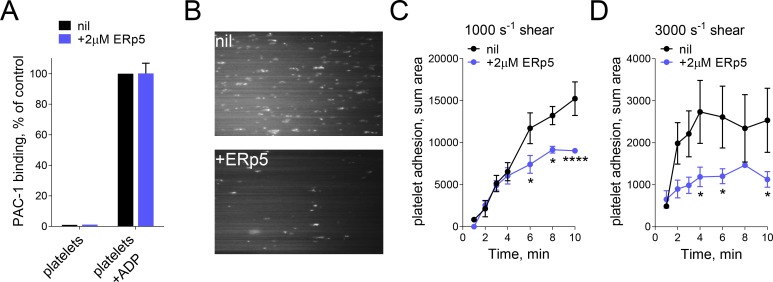
Figure 1.

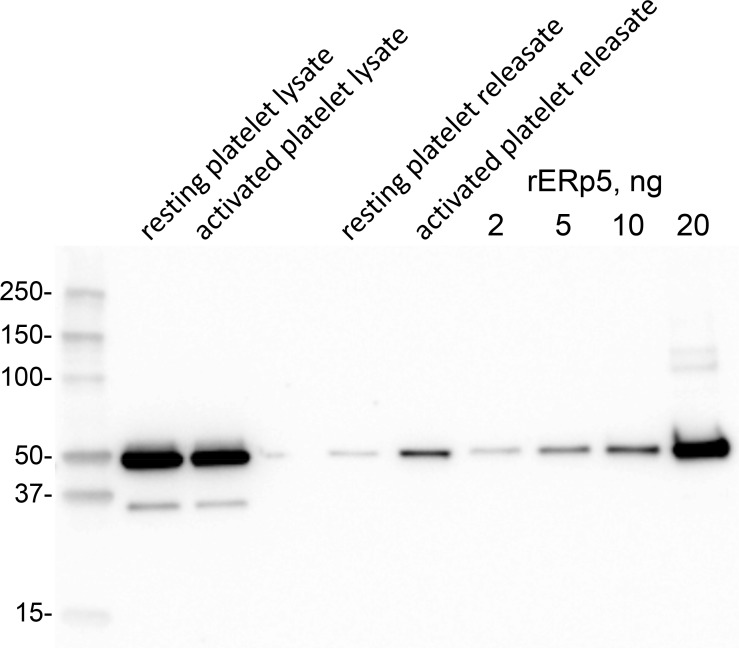
Figure 1—figure supplement 1. ERp5 level in human platelets and platelet releasate.

Figure 1—figure supplement 1.

Washed human platelets were prepared from a healthy donor. One ml of platelet suspension (363,000 per µL) was untreated or activated with 20 µM ADP for 2 min. Platelet releasate was collected by centrifugation for 15 min at 1000 g. The platelet pellet was lysed with 50 µL 2% NP40, 30 mM Hepes, 150 mM NaCl, 2 mM EDTA, pH 7.4 buffer containing proteinase inhibitor cocktail and clarified by centrifugation at 10,000 g for 20 min at 4°C. One µL of platelet lysate and 10 µL of releasate were resolved on reducing SDS-PAGE and the ERp5 immunoblotted with 1 µg/mL rabbit anti-ERp5 polyclonal antibody. Platelet ERp5 levels were calculated by reference to a standard curve of recombinant ERp5 concentrations. Densitometry of the chemiluminescent bands was performed by ImageQuant TL software (Biorad). Molecular size markers are shown at left.