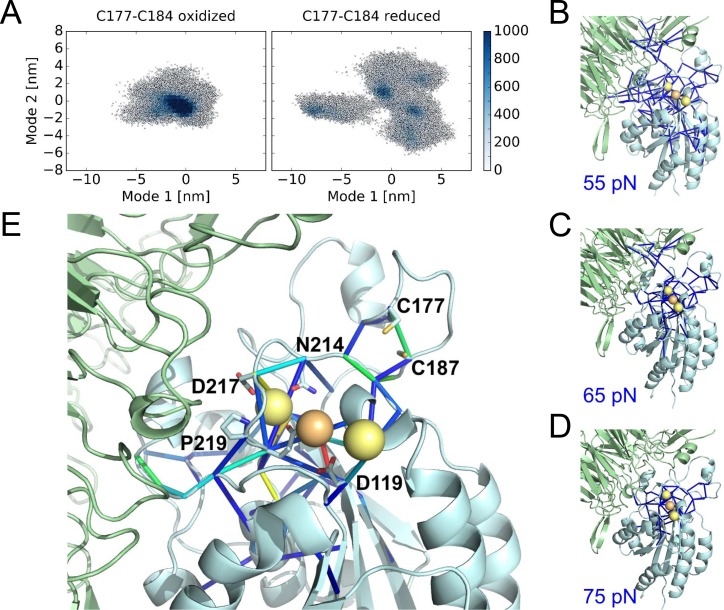
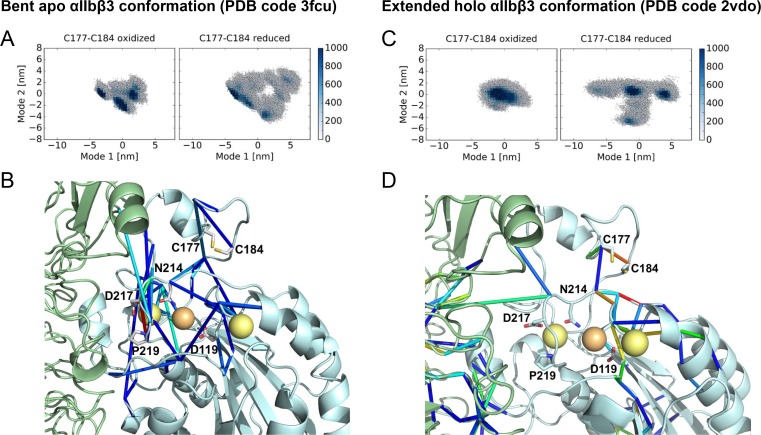
Figure 6. Cleavage of the βI disulfide increases βI-domain flexibility and stresses at the MIDAS site.
(A) Conformational distribution of the oxidized (left) and reduced (right) αIIbβ3 integrin apo headpiece along two major conformational modes as obtained from MD simulations, starting from the extended apo conformation (PDB code 3fcu). The color code shows the density of conformations, ranging from low (white) to high (dark blue) density (in arbitrary units). Disulfide reduction increases the covered area and, thus, the conformational fluctuations. (B–D) Allosteric signaling network upon reduction of the Cys177-Cys184 disulfide bond. Differences in Fpair-wise force between the oxidized and reduced integrin headpiece are shown as blue sticks for the indicated force cut-off values. Calcium and magnesium ions are presented as yellow and orange spheres, respectively, the β-propeller domain as the green cartoon and the βI-domain as the cyan cartoon. (E) Details of the Fpair-wise force difference network around the metal-binding sites in the βI domain. Stress intensity is indicated by the color spectrum as used for b-factors (spectrum ranging from 75 pN – 399 pN).


