. 2018 Jul 20;7:e36204. doi: 10.7554/eLife.36204

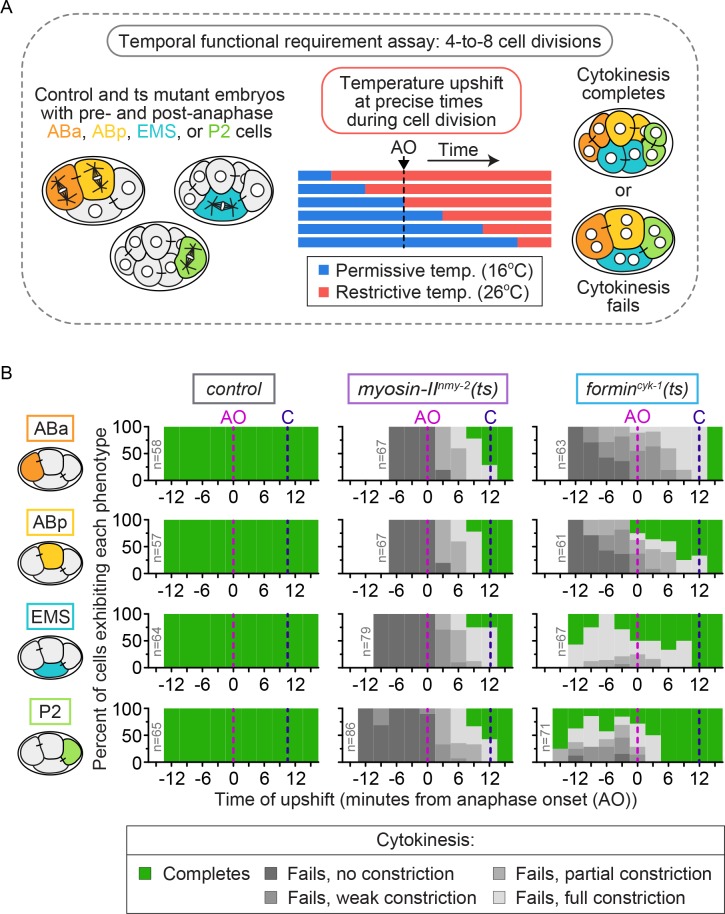
Figure 2. Cytokinetic variation in the temporal requirement for forminCYK-1, but not myosin IINMY-2, in individual blastomeres of the four-cell embryo.

(A) Schematic of the experimental protocol for the temporal functional requirement assay in which four-cell stage embryos were upshifted from permissive (16°C) to restrictive temperature (26°C) at defined time points relative to anaphase onset in each individual blastomere, then held at 26°C throughout cytokinesis. (B) Graphs showing the cytokinetic outcome for control, myosin-IInmy-2(ts), and formincyk-1(ts) mutant embryos upshifted from 16°C to 26°C at different times during cell division. The cytokinetic outcome of each cell is plotted as a percent of the total number of cells upshifted to 26°C at that time relative to anaphase onset. AO = anaphase onset (magenta dashed line); C = approximate time of contractile ring closure at 16°C (dark blue dashed line); n ≥ 57 for each cell type (see Supplementary file 1).

Figure 2.

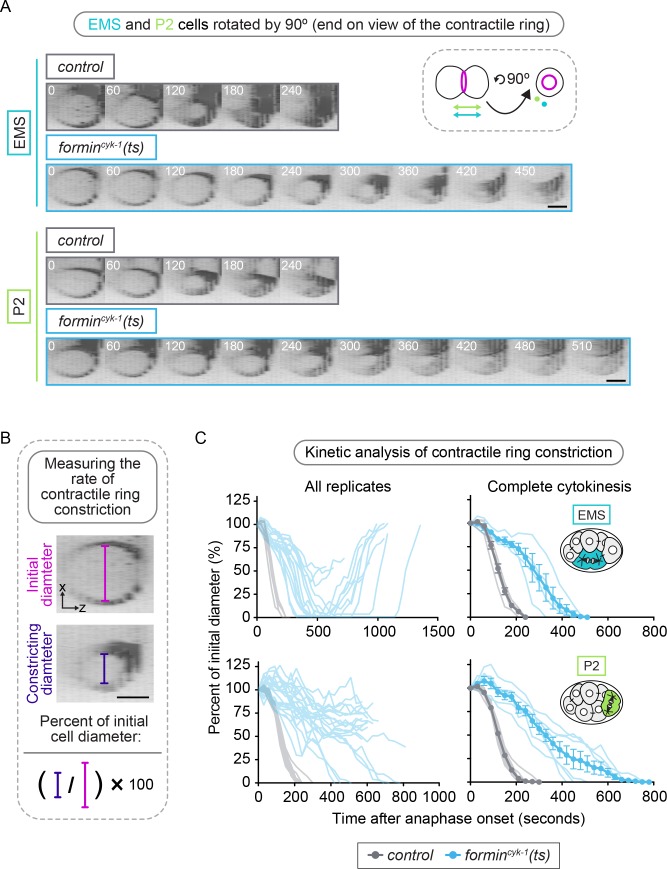
Figure 2—figure supplement 1. Loss of forminCYK-1 slows division in EMS and P2 cells.

Figure 2—figure supplement 1.

(A) GFP::PH showing the plasma membrane during successful cell division in EMS and P2 cells from control and formincyk-1(ts) mutant embryos. 13 × 2.5 μm Z-sections were rotated 90° (see schematic) to show an X-Z projection of the division plane for each time point. White numbers = Time (sec) after anaphase onset. (B) Schematic showing measurement of contractile ring diameter and normalization relative to initial (metaphase) cell diameter. (C) Graphs showing contractile ring constriction over time for EMS and P2 cells in control and formincyk-1(ts) mutant embryos. All replicates are shown on the left. Cells that complete cytokinesis are shown on the right (individual replicates (thin lines); mean (thick lines)). EMS and P2 cells underwent contractile ring constriction more slowly in formincyk-1(ts) mutant embryos compared with in control embryos. Time 0 = last time point before anaphase onset; error bars, mean ± SEM; temperature, 16 or 26°C; scale bar = 10 µm. See also Supplementary file 1.