. 2018 Jul 20;7:e36204. doi: 10.7554/eLife.36204

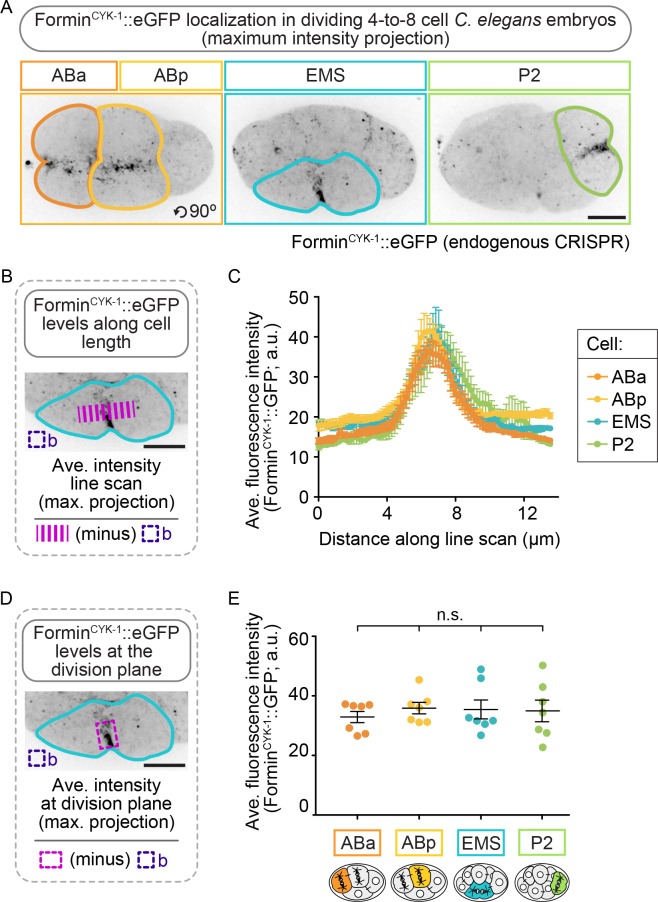
Figure 3. ForminCYK-1 localizes to the contractile ring at similar peak levels in the ABa, ABp, EMS and P2 cells.

(A) Representative maximum intensity projection images showing forminCYK-1::GFP localization at the division plane in ABa and ABp (left panel), EMS (center panel), and P2 (right panel). Images were acquired after observation of the onset of contractile ring constriction (initial furrowing). (B) Schematic showing how forminCYK-1::GFP levels were measured along a line scan across the division plane. (C) Graph showing all four cells show a local peak in the level of forminCYK-1::GFP at the division plane. (D) Schematic showing how forminCYK-1::GFP levels at the division plane were measured. (E) Graph showing the average fluorescence maximum intensity of forminCYK-1::GFP at the contractile ring is not significantly different between ABa, ABp, EMS, or P2. Two-tailed t-test (Supplementary file 1); n.s., no significance, p>0.05. Error bars, mean ± SEM; temperature, 21°C; scale bar = 10 µm.

Figure 3.

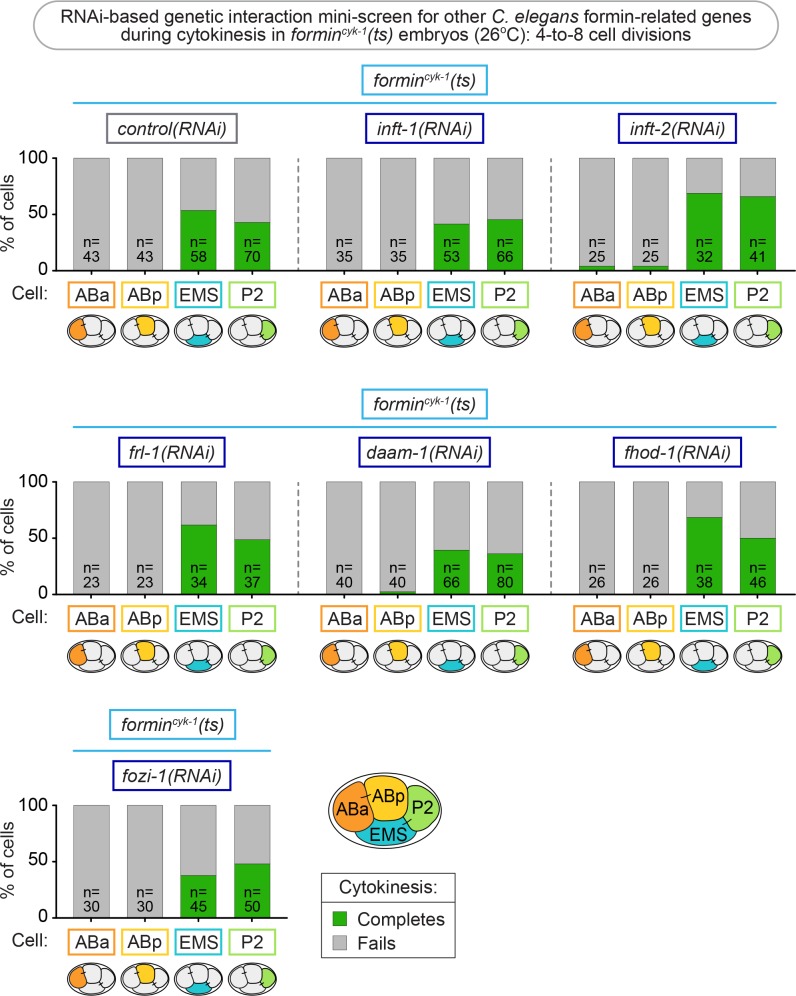
Figure 3—figure supplement 1. Depletion of other formin-related genes does not prevent cytokinesis in EMS and P2 cells following forminCYK-1 inhibition.

Figure 3—figure supplement 1.

Graphs showing that RNAi-mediated depletion of six other C. elegans formin-related genes (inft-1, inft-2, frl-1, daam-1, fhod-1, and fozi-1) in formincyk-1(ts) mutant embryos did not prevent EMS and P2 cells from dividing at 26°C. In formincyk-1(ts) embryos from each individual formin RNAi treatment, the cytokinesis outcome for each cell type was compared with the cytokinesis outcome from the same cell type in formincyk-1(ts) embryos treated with control(RNAi), using Fisher’s exact text to examine the significance of any depletion. In all cases, the p-values were greater than 0.05, except for the P2 cell in inft-2(RNAi); formincyk-1(ts) embryos which showed increased cytokinesis success with a p-value of 0.0299 relative to in control(RNAi); formincyk-1(ts) embryos. However, using a Bonferroni correction to control for multiple comparisons adjusts alpha to 0.05/6 (or ~0.0083), suggesting this result is not significant. See also Supplementary file 1.

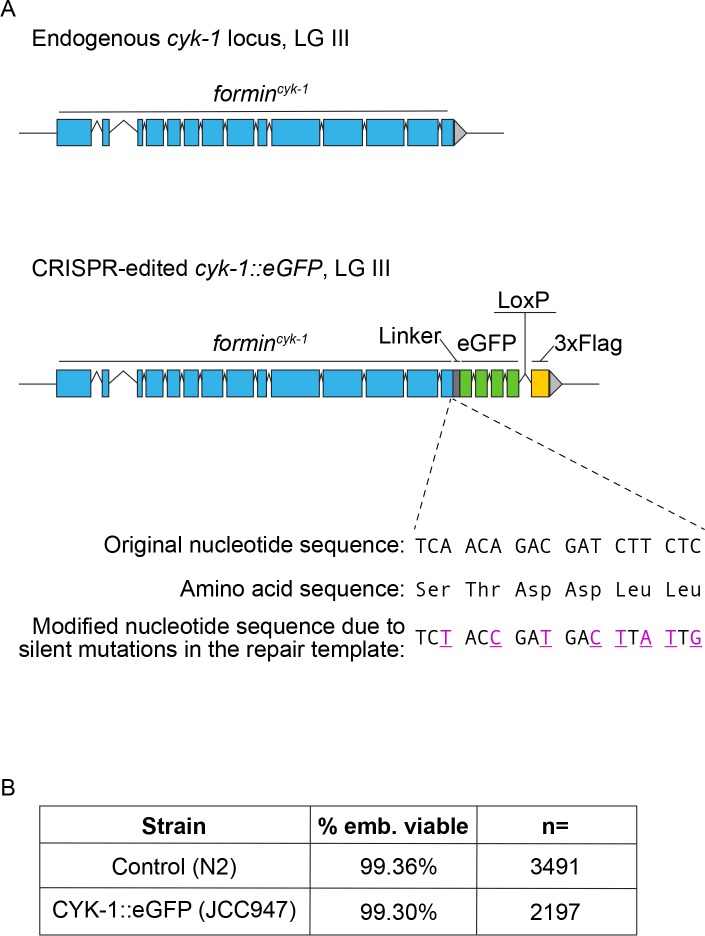
Figure 3—figure supplement 2. Generation of tagged forminCYK-1::eGFP at the endogenous locus.

Figure 3—figure supplement 2.

(A) Schematic of the cyk-1 (formincyk−1) locus, and the CRISPR modified version with the sequence for eGFP inserted at the C-terminus of forminCYK-1. (B) The eGFP tag on forminCYK-1 does not cause embryonic lethality (relative to N2 controls). The progeny of at least 10 worms were scored for each genotype. n = number of progeny scored.

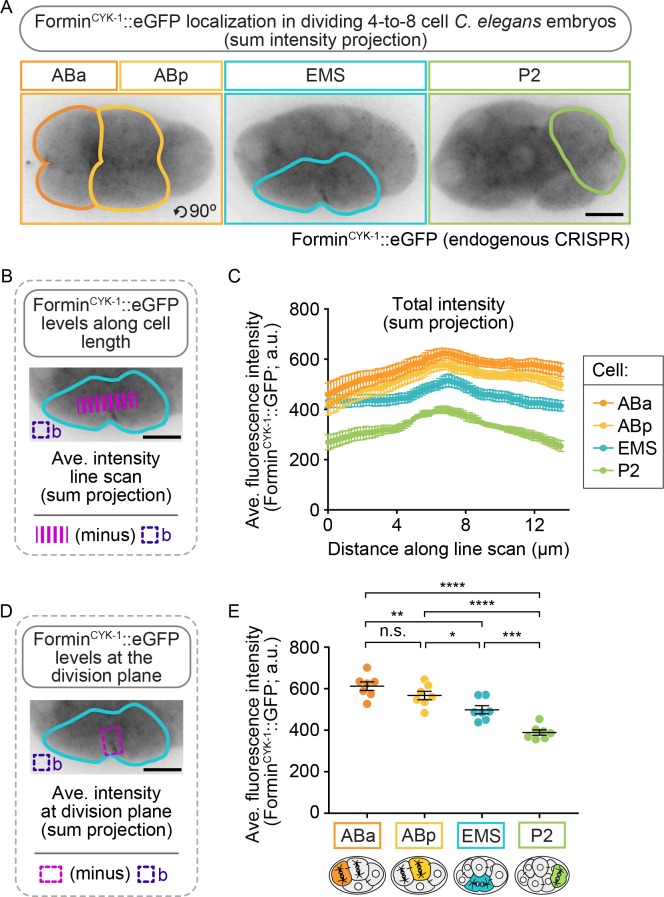
Figure 3—figure supplement 3. Sum projection analysis of forminCYK-1::GFP localization during cytokinesis in the ABa, ABp, EMS and P2 cells.

Figure 3—figure supplement 3.

(A) Representative sum intensity projection images showing the localization and total levels forminCYK-1::GFP at the division plane in ABa and ABp (left panel), EMS (center panel), and P2 (right panel). Images were acquired after observation of the onset of contractile ring constriction (initial furrowing). (B) Schematic showing how forminCYK-1::GFP levels were measured along a line scan across the division plane. (C) Graph showing all four cells show a local peak of intensity of forminCYK-1::GFP at the division plane in the sum projection, and no increase is observed in EMS or P2 relative to in ABa/ABp. However, as expected, the sum intensity signal scales roughly with cell volume, with approximately equal levels in ABa and ABp, lower levels in EMS, and the lowest total levels in P2. (D) Schematic showing how forminCYK-1::GFP levels at the division plane were measured. (E) Graph showing the average summed fluorescence intensity of forminCYK-1::GFP at the division plane is not significantly different in ABa compared to ABp, but is significantly lower in both EMS and P2; and thus roughly scales with cell volume, as expected. Two-tailed t-test (Supplementary file 1); n.s., no significance, p>0.05; *p≤0.05; **p≤0.01; ***p≤0.001; ****p≤0.0001. Error bars, mean ± SEM; temperature, 21°C; scale bar = 10 µm.