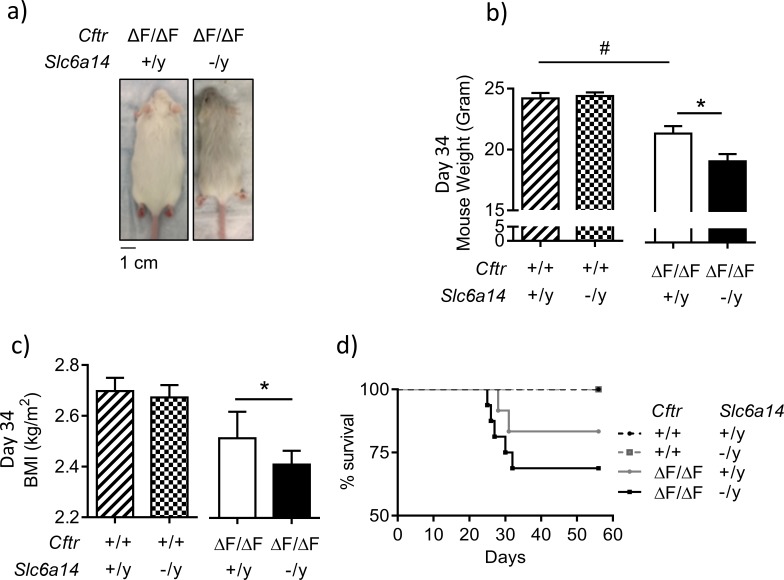
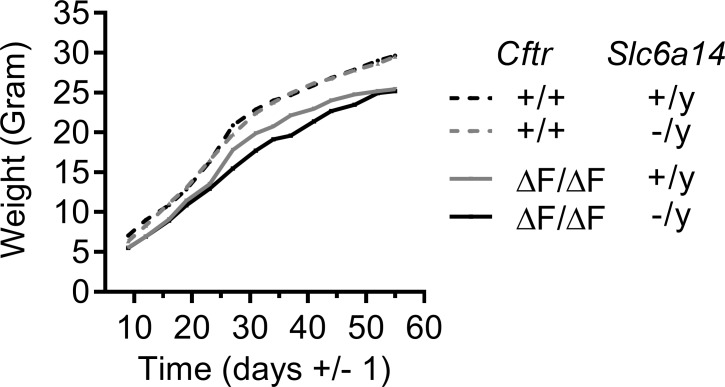
Figure 2. Disruption of Slc6a14 in F508del CF mice leads to decrease in weight gain post weaning.
(a) Dorsal view of CF (CftrF508del/F508del) mice and double mutant (CftrF508del/F508del; Slc6a14(-/y)) mice. Both were day 30 male mice. (b) Bar graph represents weights of Wt, CftrF508del/F508del, Slc6a14(-/y) and double mutant (CftrF508del/F508del; Slc6a14(-/y)) mice at day 34 (mean ± SEM). Unpaired t-test was performed (#p=0.005, *p=0.04; n ≥ 4 mice for each genotype). (c) Bar graph represents Body Mass Index (BMI) of mice at day 34 (mean ± SEM). Unpaired t-test was performed (*p=0.03; n > 5 mice for each genotype). (d) The graph represents Kaplan-Meier survival curves for the four genotypes of mice. Double mutant mice were susceptible to death post-weaning. There was no statistical difference in the survival, between Wt and F508del-Cftr mice, However, the survival of double mutant mice was significantly lower than Slc6a14(-/y) mice (Log Rank test, p=0.0036; Wt mice n = 14, Slc6a14(-/y)n = 15, CftrF508del/F508deln = 10, double mutant - CftrF508del/F508del; Slc6a14(-/y)n = 11).


