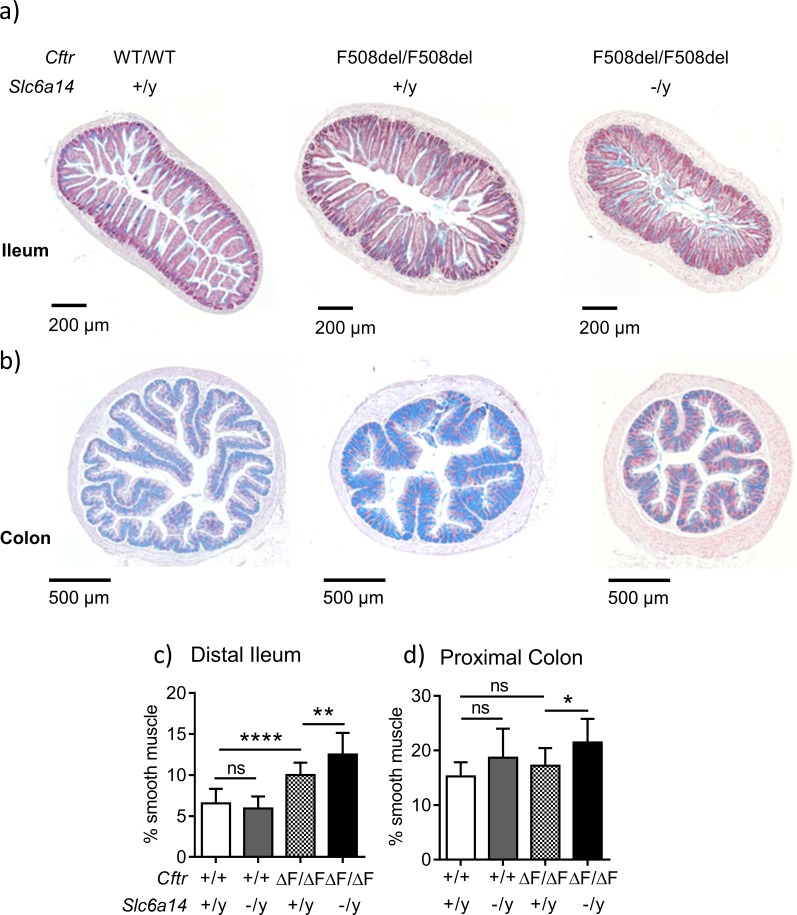
Figure 3. Slc6a14 disruption results in an increase in smooth muscle thickness in the ileum and colon.
(a) Representative distal ileal sections stained with Alcian blue, for Wt, CftrF508del/F508del and double mutant (CftrF508del/F508del; Slc6a14(-/y)) mice. (b) Representative colonic sections stained with Alcian blue, for Wt, CftrF508del/F508del and double mutant (CftrF508del/F508del; Slc6a14(-/y)) mice. (c) Bar graph represents ileal smooth muscle area relative to total section area for each genotype (mean ± SD). One-Way ANOVA with Tukey’s multiple comparison test was performed (**p=0.007, ****p<0.0001, n ≥ 4 mice for each genotype). (d) Bar graph represents colon smooth muscle area relative to total section area for each genotype (mean ± SD). One-Way ANOVA with Tukey’s multiple comparison test was performed (*p=0.042, n ≥ 4 mice for each genotype).


