. 2018 Jul 13;7:e37963. doi: 10.7554/eLife.37963

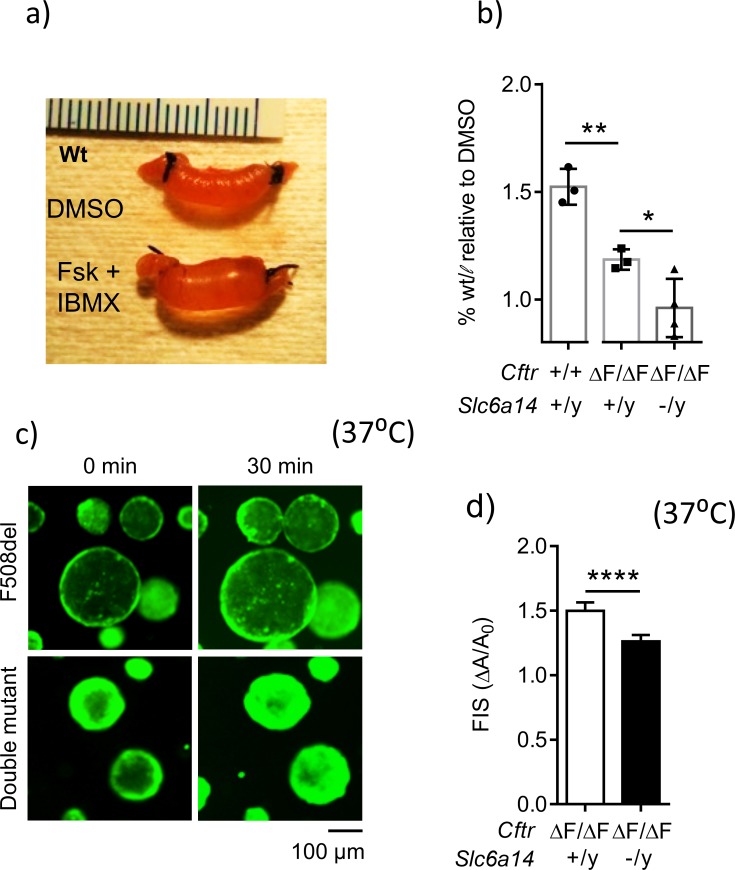
Figure 4. Loss of Slc6a14 worsens defective F508del Cftr-mediated secretion in murine colonic epithelium.

(a) In vivo closed loop assay performed on Wt mice. Each loop was injected with CFTR cAMP agonist forskolin (FSK 10 µM) and IBMX (100 µM), or DMSO vehicle. Weight relative to length is used as a measure of fluid secretion. (b) Bar graph represents fluid secretion in loops stimulated with CFTR cAMP agonist FSK and IBMX, relative to DMSO alone (mean ± SD). Fluid secretion is represented as weight/length for each loop. Wt mice showed significantly higher fluid secretion than CftrF508del/F508del (unpaired t-test, # p=0.0036, n = 3 for each genotype). Double mutant (CftrF508del/F508del; Slc6a14(-/y)) mice showed significantly lower fluid secretion than CF CftrF508del/F508del mice (unpaired t-test, *p=0.0428, **p=0.0036, n ≥ 3 biological replicates for each genotype). (c) Representative fluorescence images of murine colonic organoids derived from CftrF508del/F508del and double mutant (CftrF508del/F508del; Slc6a14(-/y)) mice, and their responses to 30 min of stimulation with FSK (1 µM). (d) Bar graph represents FSK- induced swelling (FIS) after 30 min of stimulation, in both CftrF508del/F508del and double mutant (CftrF508del/F508del; Slc6a14(-/y)) murine organoids (mean ± SD). FIS is measured as change in area of the organoid after 30 min of FIS (ΔA) relative to baseline before stimulation (A0). Unpaired t-test was performed (****p<0.0001, n > 4 biological replicates for each genotype).

Figure 4.

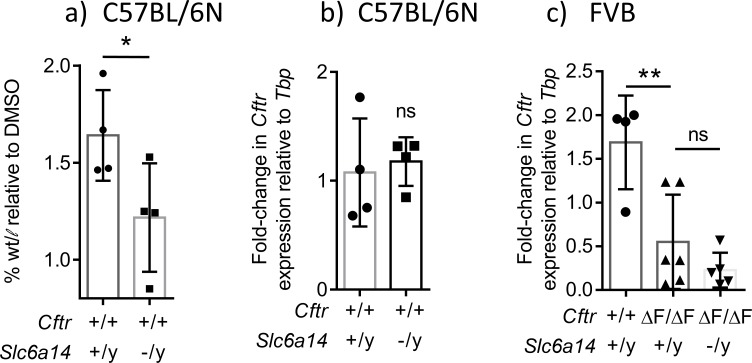
Figure 4—figure supplement 1. Disruption of Slc6a14 decreases the fluid secretory capacity of the colonic epithelium by modulating apical constituents of the epithelium.

Figure 4—figure supplement 1.

(a) Bar graph represents fluid secretory capacity of in vivo colonic closed loops stimulated with CFTR cAMP agonist FSK (10 µM) and IBMX (100 µM), relative to DMSO alone (mean ± SD). Experiments were performed on Wt and Slc6a14(-/y) mice on C57BL/6N background. Fluid secretion is represented as weight/length (w/l) for each loop stimulated with FSK and IBMX, normalized to w/l for vehicle DMSO. Paired t-test was performed (*p=0.0125, n = 4 mice for each genotype). (b) Bar graph depicts Cftr mRNA expression relative to housekeeping gene Tbp, from freshly lysed colon of Wt and Slc6a14(-/y) mice on C57BL/6N background (mean ± SD). Unpaired t-test was performed (ns = not significant, n = 4 for each genotype). These data show that the decrease in secretion does not reflect a decrease in Cftr mRNA expression (c) Bar graph represents Cftr mRNA expression relative to housekeeping gene Tbp, from freshly lysed colon of Wt, CF (CftrF508del/F508del) and double mutant (CftrF508del/F508del; Slc6a14(-/y)) mice on FVB background (mean ± SD). One-way ANOVA with Tukey’s multiple comparison test was performed (**p=0.0057, ns = not significant, n ≥ 4 for each genotype).
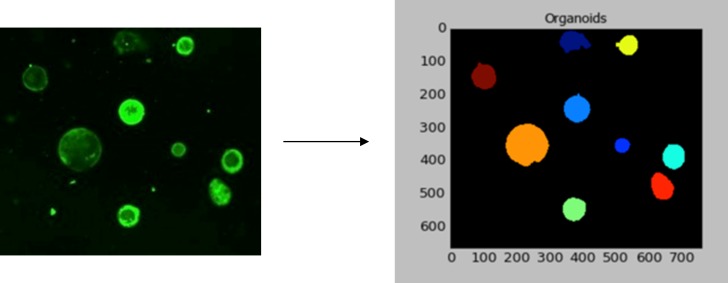
Figure 4—figure supplement 2. Analysis of FSK-induced swelling of murine colonic organoids.

Figure 4—figure supplement 2.

In a 96-well plate, at least 100 organoids/well were analyzed. Whole well stitched fluorescence images (four fields/well) were exported as TIFF files and analyzed using CellProfiler v2.01 (Carpenter Lab), as described in the methods. The figure shows a representative fluorescence image of organoids for which a mask was generated for each fluorescent object (organoid). Different colored masks represent individual organoids.