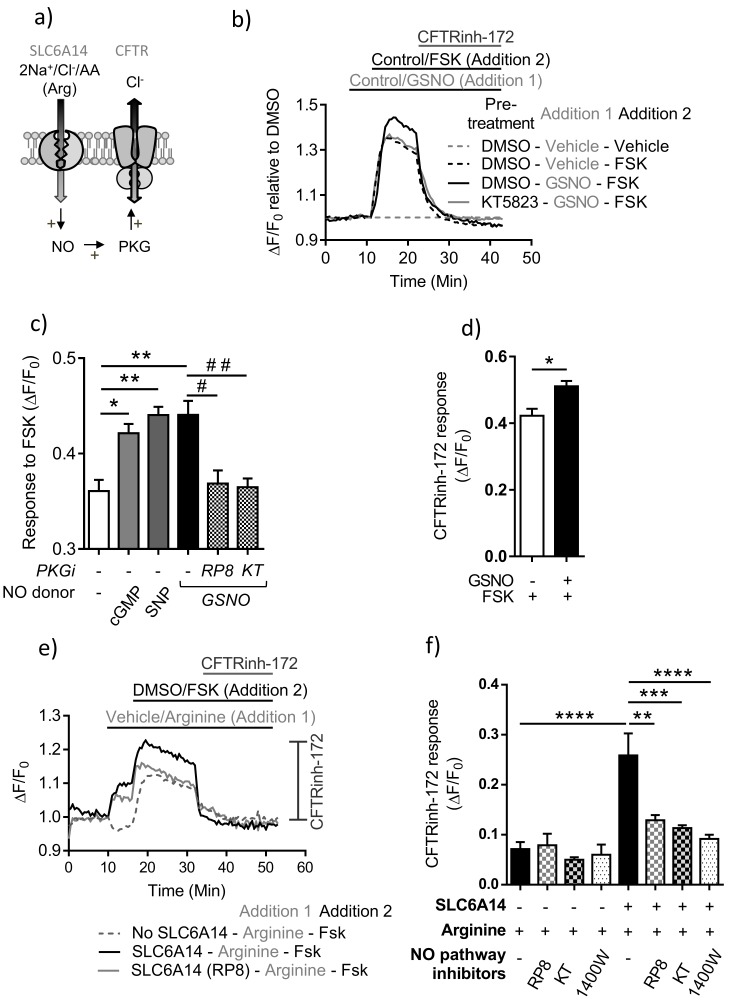
Figure 7. PKA-dependent channel activity of CFTR is enhanced by NO dependent activation of PKG in colonic epithelium.
(a) Model depicting the hypothesis that SLC6A14-mediated arginine uptake across the epithelium would lead to an increase in intracellular NO levels, which would then potentiate CFTR channel function via PKG activation. (b) Line graph represents CFTR function measured using the FLIPR® membrane potential assay in Caco-2 colonic intestinal epithelial cells. Cells were pre-treated with PKG inhibitor KT5823 (1 µM) or DMSO control. After reading baseline intracellular NO levels were increased using NO donor GSNO (10 µM) or vehicle control, followed by cAMP activation of CFTR using FSK (10 µM) or DMSO vehicle. (c) Bar graph represents response to FSK from baseline (ΔF/F0), in Caco-2 cells pre-treated with PKG inhibitors Rp-8-pCPT-cGMPS (RP8), KT5823 or vehicle DMSO, followed by addition of NO donor GSNO as shown in Figure 7b. The effect on FSK response by another NO donor SNP (50 µM) and direct increase of intracellular cGMP (10 µM) was also studied in this system. Mean ± SEM are plotted. One-way ANOVA with Tukey’s multiple comparison test was performed (*p=0.006, **p=0.0001, # p=0.004, # # p=0.002, n = 3 biological replicates). (d) Bar graph represents CFTRinh-172 (10 µM) response, elicited at the end of the experiment after full CFTR activation. Mean ± SEM are plotted. Unpaired t-test was performed (*p=0.007, n = 3 biological replicates). (e) Line graph represents CFTR function measured using the FLIPR® membrane potential assay in Caco-2 epithelial cells transduced with SLC6A14-GFP or control GFP alone. Cells were pre-treated with PKG inhibitors Rp-8-pCPT-cGMPS (10 µM), KT5823 (1 µM), or iNOS inhibitor 1400W (50 µM) or DMSO control. After reading for baseline, SLC6A14 was stimulated using L-arginine (1 mM) or vehicle control, followed by cAMP activation of CFTR using FSK (10 µM) or DMSO vehicle. This was followed by addition of CFTRinh-172 (10 µM). (f) Bar graph represents CFTRinh-172 (10 µM) response, elicited at the end of the experiment after full CFTR activation, in Caco-2 cells over-expressing SLC6A14-GFP or control GFP. Mean ±SEM are plotted. One-way ANOVA with Tukey’s multiple comparison test was performed (****p<0.0001, **p=0.003, ***p=0.0001, n = 3 biological replicates).


