. 2018 Jun 14;7:e36656. doi: 10.7554/eLife.36656

Figure 5. Mechanism of Danusertib binding to Aurora A at 25°C.

(A) Danusertib bound to the DFG-out conformation of Aurora A is shown highlighting important active-site residues in stick representation (PDB 2J50 [Fancelli et al., 2006]). (B) The increase in fluorescence upon Danusertib binding is fitted to a double exponential. (C) Plot of kobs,Binding versus the concentration of Danusertib for the fast phase yields k2 = 0.4 ± 0.1 μM−1s−1 and k-2 = 4.6 ± 3 s−1 and the kobs,IF for the slow phase (D) reaches a plateau around 16 ± 2 s−1. (E) Dissociation of Danusertib from Aurora A at 25°C after a 30-fold dilution of the Aurora A/Danusertib complex measured by Trp-fluorescence quenching and fitting with single exponential gives a value of k-3 = (3.2 ± 0.3) × 10−4 s−1. (F) Double-jump experiment (2 s incubation time of 1 μM Danusertib to Aurora A followed by 60 s long dissociation step initiated by a wash with buffer) was measured by Creoptix WAVE waveguide interferometry to properly define the value of k-2 = 6.8 ± 0.4 s−1. (G) Macroscopic dissociation constant (KD) determined by Creoptix WAVE waveguide interferometry: surface-immobilized Aurora A was incubated with various concentrations of Danusertib (0.1 nM (black), 0.2 nM (blue), 0.4 nM (purple), 0.8 nM (red), 2.4 nM (green), 7.2 nM (pink), 21.6 nM (cyan), and 64.8 nM (orange)) and surface mass accumulation was observed until establishment of equilibrium. (H) A plot of the final equilibrium value versus Danusertib concentration yields a KD = 1.1 ± 0.4 nM. (I) Binding scheme of Danusertib (labeled D) highlighting a three-step binding mechanism, containing both conformational selection and induced-fit step. Red lines in (B, F) and black line in (E) are the results from fitting. Kinetic constants shown in I determined from global fitting (Figure 6). Fluorescence traces are the average of at least five replicate measurements (n > 5), and error bars and uncertainties given in C-E, H, and I denote the (propagated) standard deviation in the fitted parameter.

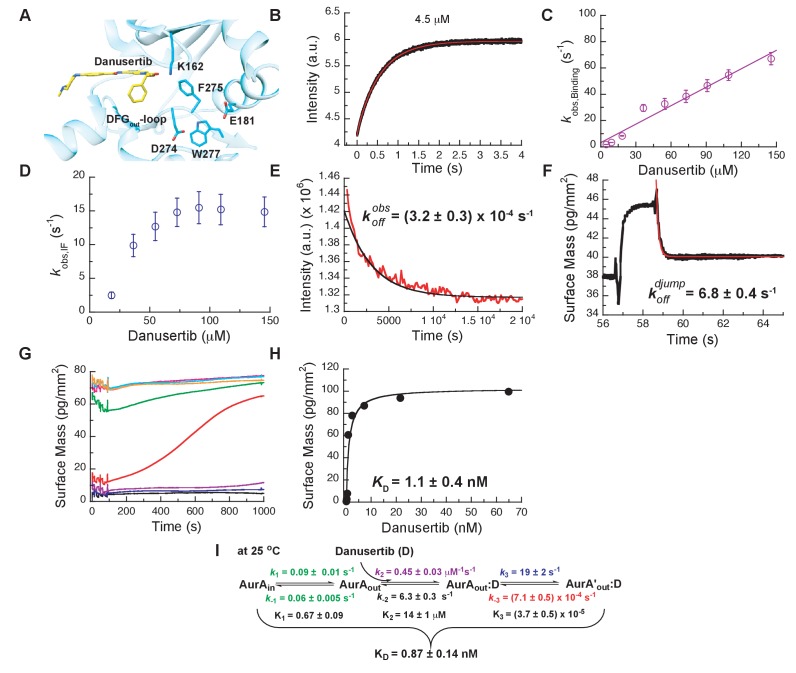
Figure 5.

Figure 5—figure supplement 1. Additional kinetic experiments to corroborate the three-state binding mechanism for Danusertib to Aurora A.

Figure 5—figure supplement 1.

(A) Kinetic trace at 35°C of 18.2 µM Danusertib binding to 0.1 µM Aurora A. The red line represents the best fit of the trace to a double exponential function. The initial fast increase in fluorescence is a convolution of the fast binding and induced-fit steps, whereas the slower phase gives an observed rate constant of approximately 0.1 s−1, suggestive of a third process (i.e., conformational selection). (B) Double-jump experiments measured with Creoptix WAVE waveguide intereferometry at 25°C using Danusertib and a 0.2, 0.4, 0.8 and 2 s incubation time. In the first step of the double jump, Danusertib is incubated with surface-immobilized Aurora A kinase before washing with buffer alone initiates dissociation in a second step. All traces show a single exponential decay with an observed rate constant of 6 s−1 and its amplitude increases with longer incubation time as more AurAout:D is formed. (C) Dilution of the Aurora A/Danusertib complex formed after 1 hour of incubation. The slow dissociation of Aurora A/Danusertib (limited by k3) was measured by Creoptix WAVE waveguide interferometry and fitted to a single exponential with a value of k-3 = (2 ± 0.6) × 10−4 s−1. (D) Representative selection of emission spectra obtained after the addition of increasing concentrations of Danusertib (0–11.25 nM from dark to light blue) to Aurora A (excitation at 295 nm). Plot of the increase in fluorescence intensity at 368 nm versus Danusertib concentration yields a KD value of 0.4 ± 0.1 nM determined by fitting the data to Equation 6. Fluorescence trace in A is the average of five replicate measurements (n = 5), and the uncertainties given in D denotes the standard deviation in the fitted parameter.
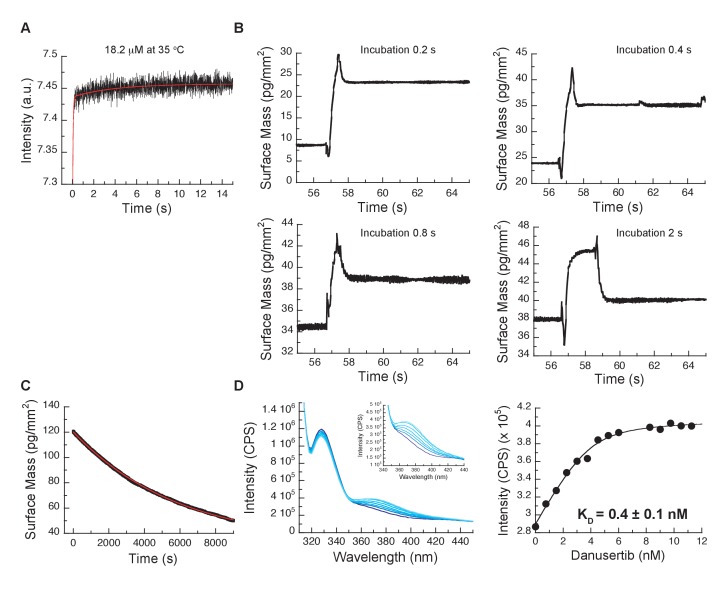
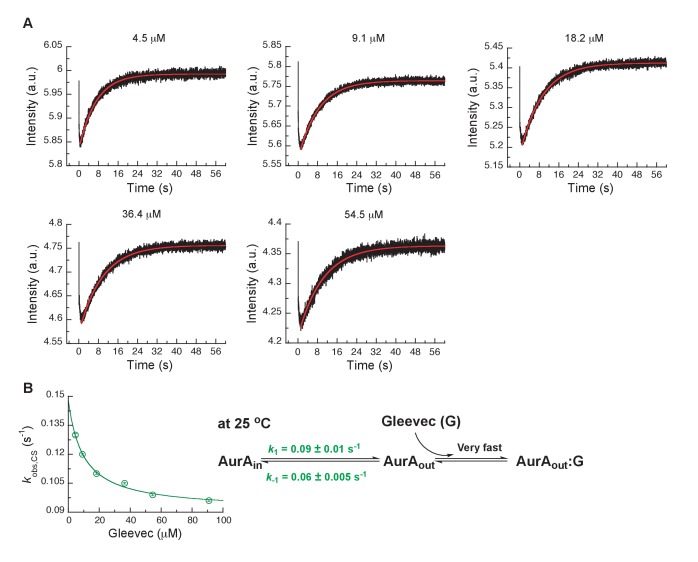
Figure 5—figure supplement 2. Kinetics of Gleevec binding to Aurora A at 25°C to determine DFG-in/DFG-out equilibrium in apo Aurora A.

Figure 5—figure supplement 2.

(A) 0.5 µM Aurora A was mixed with indicated Gleevec concentrations. The increase in fluorescence intensity of slow phase reflects the conformational selection step (see Figure 3A). (B) kobs,CS of the slow phase as a function of the Gleevec concentration is an inverse hyperbolic function and fitting to Equation 1 gives k1 = 0.09 ± 0.01 s−1 and k-1= 0.06 ± 0.005 s−1. Corresponding binding scheme is depicted. Fluorescence traces are the average of at least five replicate measurements (n > 5), and error bars and uncertainties given in B denote the standard deviation in the fitted parameter.