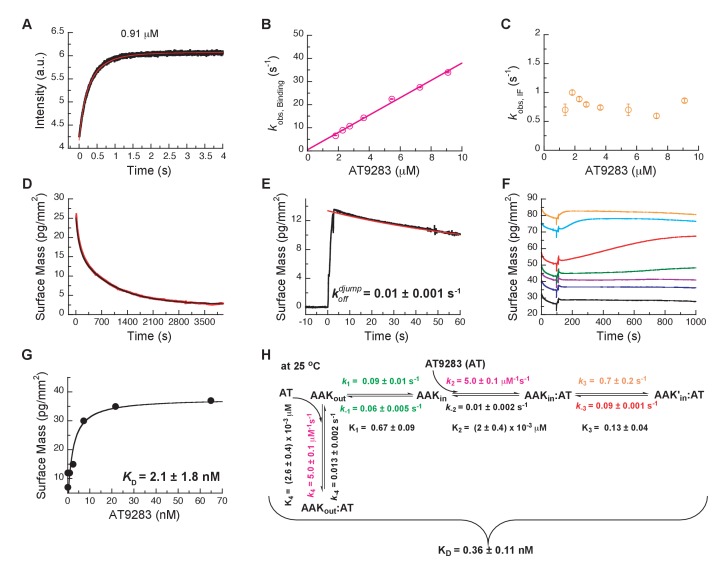
Figure 7. Mechanism of AT9283 drug binding to Aurora A at 25°C.
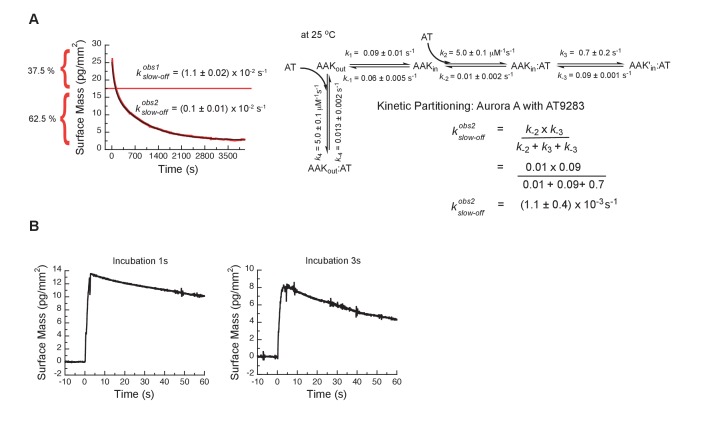
(A) The increase in fluorescence at 25°C upon AT9283 binding fitted to a double exponential. (B) The plot of versus AT9283 concentration for the fast phase yields = 3.4 ± 0.5 μM−1s−1 and an underdetermined intercept () and (C) the of the slow phase reaches a plateau around 0.8 ± 0.2 s−1. (D) Dilution of the Aurora A/AT9283 complex formed after 1 hour of incubation. The slow dissociation was measured by Creoptix WAVE waveguide interferometry and fitted with a double exponential with rate constants of (1.1 ± 0.02) × 10−2 s−1 and (0.1 ± 0.01) × 10−2 s−1. (E) Double-jump experiments (1 s incubation time of 1 μM AT9283 to Aurora A followed by 60 s long dissociation step initiated by a wash with buffer) was measured by Creoptix WAVE waveguide interferometry to properly define the value of = (1.0 ± 0.1) x 10−2 s−1. (F) Macroscopic dissociation constant () determined by Creoptix WAVE waveguide interferometry: surface-immobilized Aurora A was incubated with various concentration of AT9283 (0.03 nM (black), 0.27 nM (blue), 0.8 nM (purple), 2.4 nM (green), 7.2 nM (red), 21.6 nM (cyan), and 64.8 nM (orange)) and surface mass accumulation was observed until establishment of equilibrium. (G) A plot of the final equilibrium value versus AT9283 concentration yields a = 2.1 ± 1.8 nM. (H) Binding scheme for AT9283 (labeled AT) highlighting a four-steps binding mechanism, that contains binding to two different states, a conformational selection mechanism and an induced-fit step. Kinetic constants shown in H were determined from global fitting (see Figure 8). Fluorescence traces are the average of at least five replicate measurements (n > 5), and error bars and uncertainties given in B, C, G and H denote the (propagated) standard deviation in the fitted parameter.


