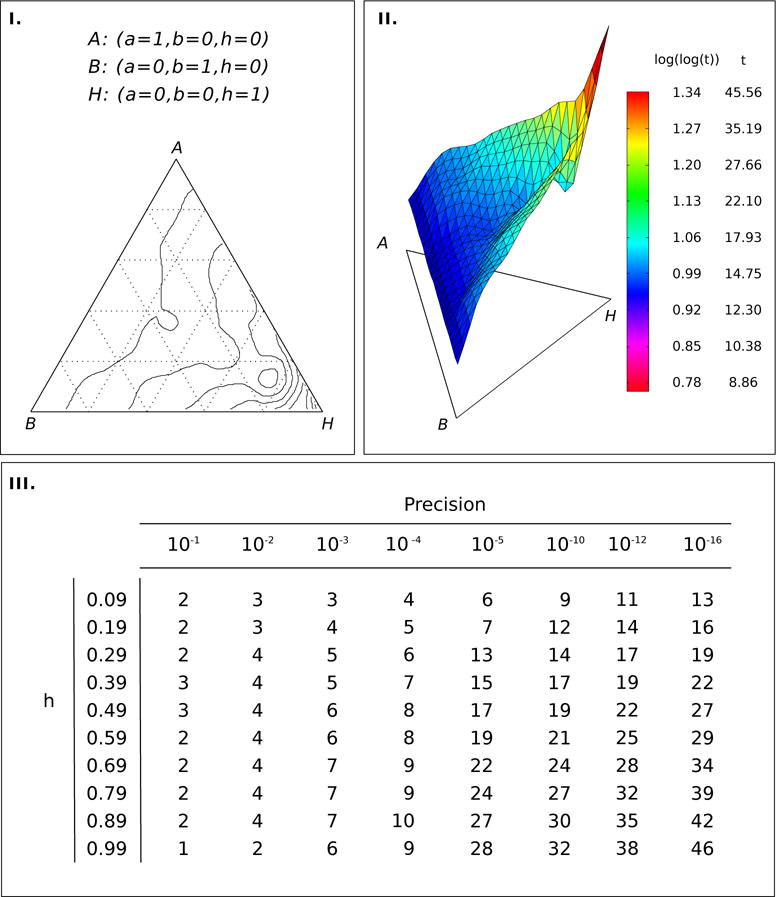
Figure 2.

Time to convergence to the stationary distribution in the single-stage admixture model: I.) The contour plot for time to convergence in a two-dimensional simplex with coordinates (a, b, h). II.) The surface of the contour plot. The legend on the right shows the height of the surface in double log scale and the corresponding number of generations (t) to convergence. The convergence is assumed to be attained at accuracy 10−16. Time to convergence is small unless h, the contribution from the hybrid population to itself is close to 1. III. The table entries are time to convergence for different values of h at different accuracies. For example, h = 0.39 and precision 10−3 gives the time to convergence as 5 generations. For all cases in the table a = b = (1 − h)/2.
