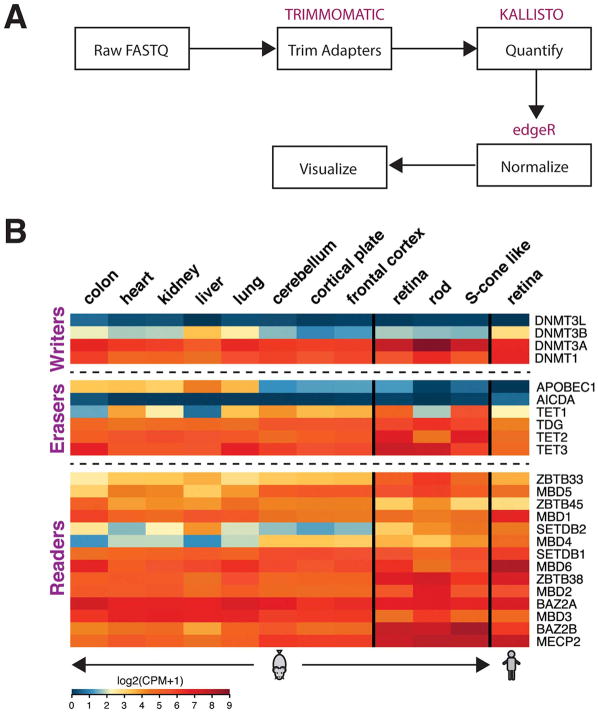
Fig. 2.
Expression of writers, erasers and readers of DNA methylation. (A) Schematic of expression analysis. Raw RNA-seq reads from adult mouse tissues and human retina were initially filtered for low quality and adapter contamination using Trimmomatic (v0.36). Transcript level quantification was performed using the kallisto (v0.43) utility. All data were analyzed as single end sequences. Gene level quantification was computed using the tximport R package on Ensembl (version 84 and 82 for mouse and human data sets, respectively). Normalization was performed using trimmed mean of M-values (TMM) and counts per million (CPM) values were computed using the edgeR package. RNA-seq data were obtained from the following sources: sorted rods and S-cone-like cells (Kim et al., 2016b), mouse retina (Hoshino et al., 2017), unpublished human retina (available at https://neicommons.nei.nih.gov/#/), and non-retinal tissues (Pervouchine et al., 2015). (B) Heatmaps of expression data from indicated adult tissues. We included only genes having a one-to-one mapping between human and mouse annotations. The retina expression data are more similar to neural tissues. Scale of expression values is shown as log2 of Counts per million (CPM) +1, with blue representing low and red high expression values.

