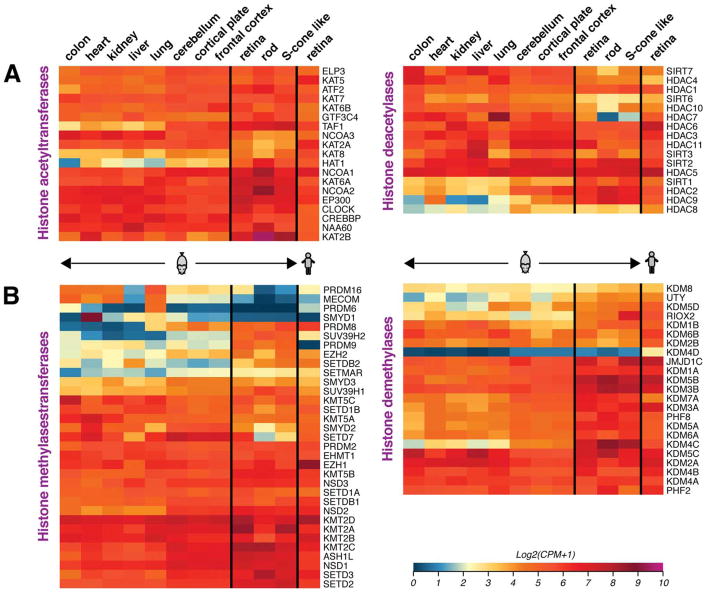
Fig. 5.
Heatmaps showing gene expression of enzymes that catalyze (de)acetylation and (de)methylation of lysine residues in histone H3 and H4 Nter tails. Expression data was extracted from RNA-seq profiles of indicated tissues and cell types, as elaborated in the legend of Fig. 2. While a majority of genes are widely expressed, the retina displays unique patterns of expression. High expression of Setd7, Hdac7 and Prdm16 in the retina, but not in photoreceptors, suggests their potential functions in the inner retina. Scale of expression values is shown as log2 of Counts per million (CPM) +1, with blue representing low and red high expression values.

