
Figure 3.
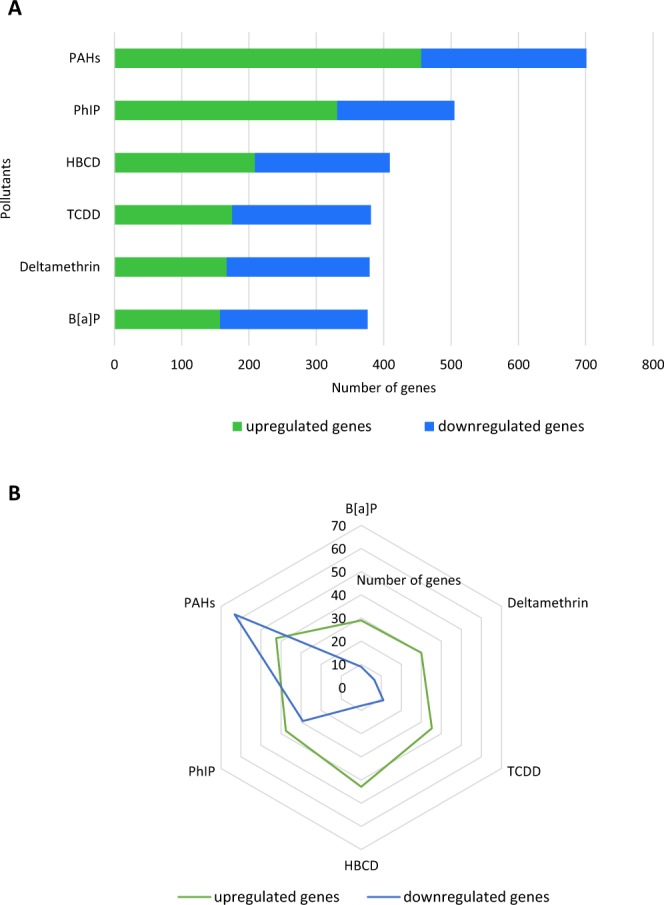
Differentially expressed microbial genes after the 24 hr of pollutant exposure. (A) Number of differentially expressed genes. (B) Mean abundances in CPM of the differentially expressed genes. Analysis was performed on the pooled rRNA-depleted RNA arising from five technical replicates. Only genes with at least a 3-fold change are represented, and values were derived from a comparison between the pollutant and the vehicle condition.