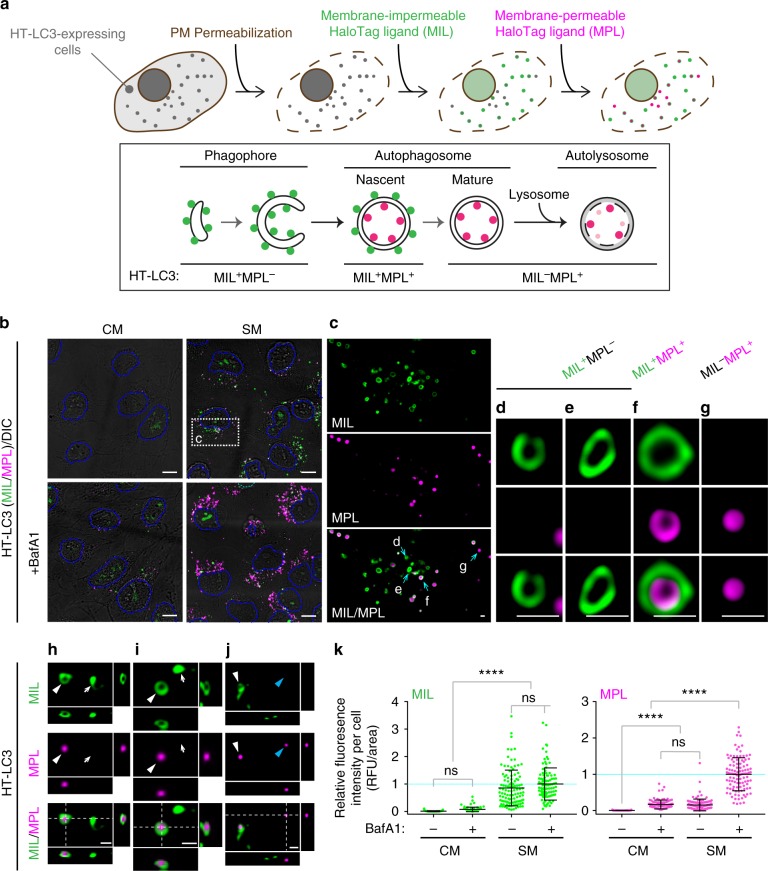
Fig. 1.
The HaloTag-LC3 autophagosome completion assay distinguishes unclosed and closed autophagosomal membranes. a Schematic strategy of the HT-LC3 autophagosome completion assay. The assay is performed by the following procedures: step 1, after the induction of autophagy, HT-LC3-expressing cells are treated with cholesterol-complexing agents including recombinant perfringolysin (rPFO/XF-MPM) or digitonin to permeabilize the plasma membrane (PM) and release HT-LC3-I from the cytosol; step 2, cells are incubated with a saturating dose of membrane-impermeable HT ligand (MIL) to stain membrane-bound HT-LC3-II that is accessible to the cytosol (MIL also diffuses into nucleus and stains nuclear LC3); step 3, cells are incubated with membrane-permeable HT ligand (MPL) to stain LC3-II that is sequestered within membranes. b–j HT-LC3 U-2 OS cells were incubated in starvation medium (SM) or control complete medium (CM) in the presence or absence of 100 nM BafA1 for 4 h (b–g) or starved for 3 h (h–j) and subjected to the HT-LC3 autophagosome completion assay followed by confocal microscopy (b–g) and 3D-deconvolution fluorescence microscopy (h–j). LC3 signals on the phagophore or the outer autophagosomal membrane, and in the autophagosome lumen were stained using Alexa Fluor 488 (AF488)-conjugated MIL and tetramethylrhodamine (TMR)-conjugated MPL, respectively. Magnified images of the boxed area in (b) and arrow-indicated areas in (c) are shown in (c) and (d–g), respectively. In (h–j), xz and yz images at the dash-lined area in Supplementary Fig. 1c are shown to the right and bottom, respectively; arrows, white arrowheads and blue arrowheads indicate MIL+MPL−, MIL+MPL+, and MIL−MPL+ structures, respectively. The scale bars represent 10 μm and 1 μm in (b) and (c–j), respectively. (k) The cytoplasmic fluorescence intensities of MIL and MPL in each cell in (b) were quantified and normalized to the respective mean fluorescence intensities of the cells starved in the presence of BafA1 (n > 100). Data shown are representative of three independent experiments. Statistical significance was determined by one-way ANOVA followed by Tukey’s multiple comparison test. All values are mean ± SD. ns not significant; ****p ≤ 0.0001

