Fig. 5.
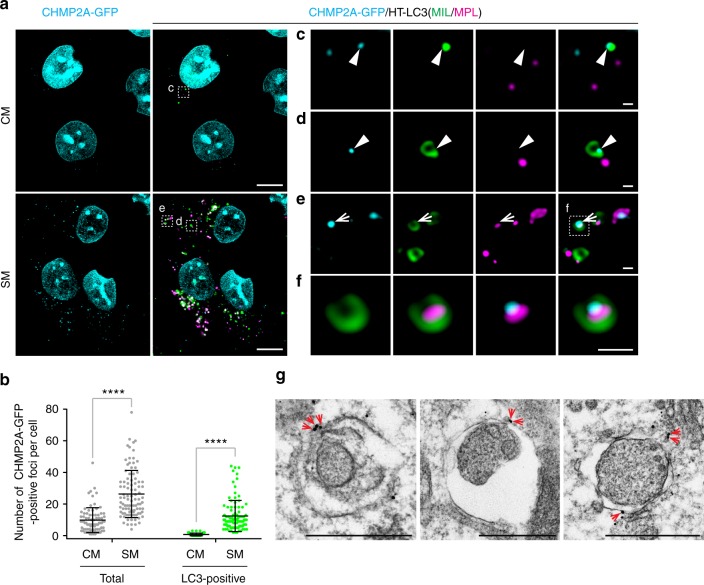
CHMP2A translocates to the phagophore in response to nutrient starvation. a HT-LC3 U-2 OS cells were transduced with lentiviruses encoding CHMP2A-GFP and cultured for 6 days. The resultant cells stably expressing CHMP2A-GFP were incubated in CM or SM for 2 h and subjected to the HT-LC3 autophagosome completion assay using AF660-conjugated MIL and TMR-conjugated MPL followed by confocal microscopy. b The number of total and LC3-associated CHMP2A-GFP-positive foci per cell in (a) was quantified and shown as dot plots (n > 80). Statistical significance was determined using two-way ANOVA with Sidak’s multiple comparison test. All values are mean ± SD. ****p ≤ 0.0001. Data shown are representative of two independent experiments. c–f Magnified images in the boxed areas in (a) are shown. Arrowheads and arrows indicate colocalization of CHMP2A with a MIL+MPL− phagophore-like and a MIL+MPL+ immature autophagosome-like structures. g CHMP2A-GFP-expressing U-2 OS cells were starved for 2 h and subjected to immunoelectron microscopy using anti-GFP antibody. The scale bars represent 10 μm, 1 μm, and 500 nm in (a), (c–f), and (g)

