Fig. 6.
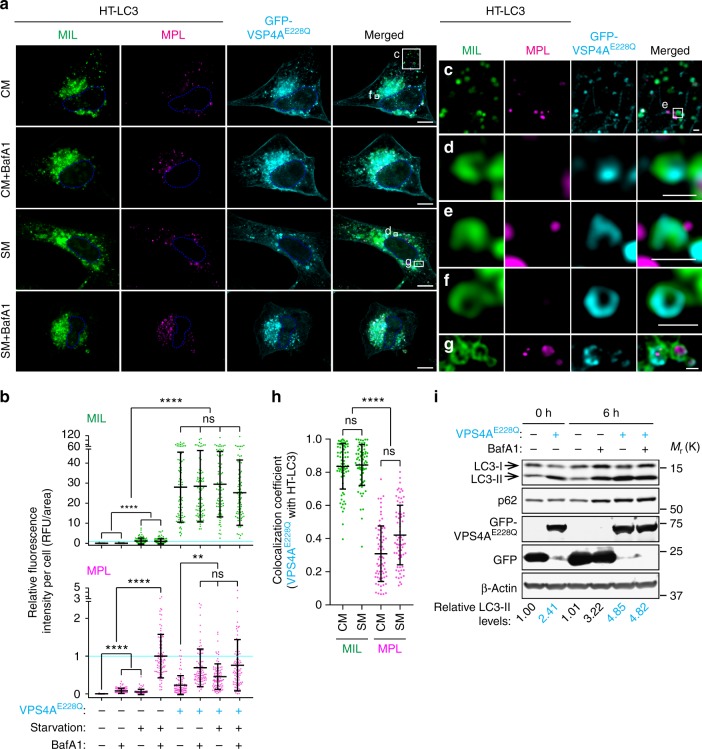
Inhibition of VPS4 accumulates MIL+MPL− phagophores and impairs autophagic flux. HT-LC3 U-2 OS (a–h) and wild-type U2-OS cells (i) were transfected with GFP-VPS4AE228Q or control GFP. a Twelve hours after the transfection, cells were incubated in CM or SM for 3 h and subjected to the HT-LC3 autophagosome completion assay followed by confocal microscopy. The scale bars represent 10 μm and 1 μm in the magnified images. b The cytoplasmic fluorescence intensities of MIL and MPL per cell in (a) were quantified and normalized to the respective mean fluorescence intensities of control GFP transfected cells starved in the presence of BafA1 (n > 81). Data shown are representative of two independent experiments. (c–g) Magnified images in the boxed areas in (a) are shown. h Colocalization coefficient of GFP-VPS4AE228Q with MIL or MPL-labeled HT-LC3 per cell in (a) were quantified and shown (n > 72). In (b and h), statistical significance was determined by Kruskal–Wallis one-way ANOVA on ranks followed by Dunn’s multiple comparison test. All values are mean ± SD. ns not significant; **p ≤ 0.01; ****p ≤ 0.0001. i Six hours after transfection (0 h time point), cells were incubated in the presence or absence of 100 nM BafA for 6 h and subjected to immunoblotting using the indicated antibodies. The LC3-II levels relative to respective β-actin were quantified and normalized to the value of control GFP cells at time 0

