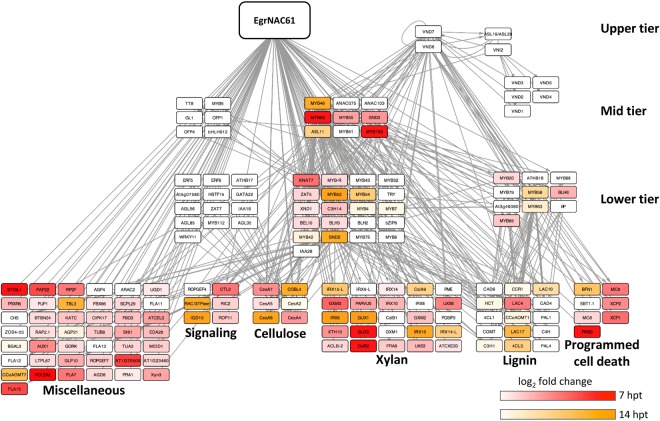
Figure 4.
Time-course activation of the Arabidopsis SCW transcriptional network following EgrNAC61 induction. The red heatmap indicates the fold change (log2) of transcripts activated at 7 hpt (hours post-transfection). The orange heatmap indicates the fold change (log2) of nodes that were exclusively upregulated at 14 hpt. Structural genes (bottom tier) are grouped according to biological function. The transcriptional network scaffold was adapted from Hussey et al.52.

