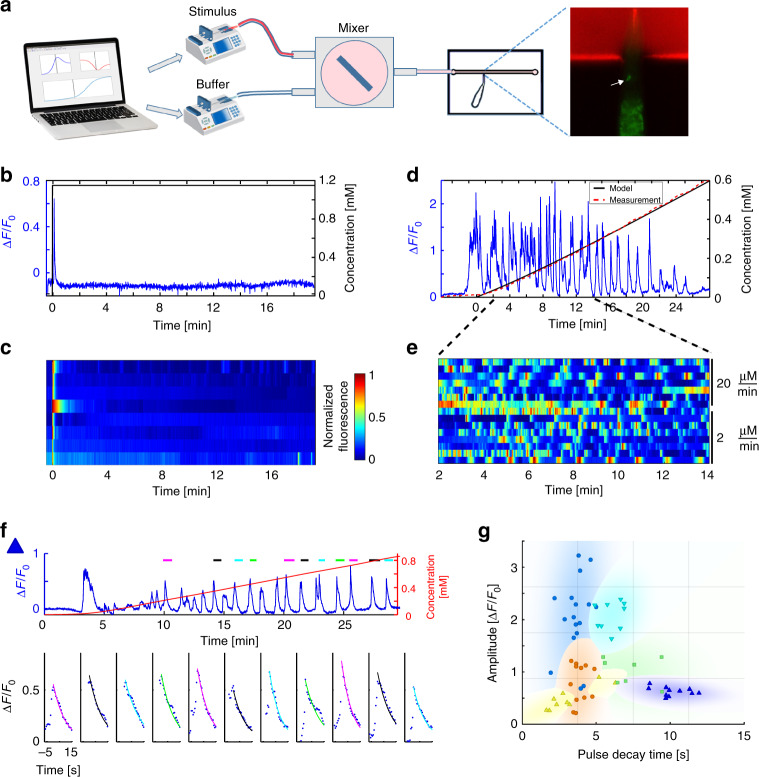
Fig. 1.
Smooth increasing gradients are coded by a pulsatile activity. a Illustration of the experimental setup. Two computer-controlled syringe pumps flow the stimulus (diacetyl with red dye, top) and the buffer (bottom) into a mixing chamber. The homogenous stirred mixture flows through a restrained worm inside a microfluidic device. GCaMP (green) and rhodamine dye (red) intensities are imaged. The right panel shows the restrained worm inside the chip, with the red dye in the flow channel. The white arrow points to the AWA neuron. b A step function of diacetyl (black) results in a single pulse. c AWA activity in response to a step function of diacetyl (N = 8). The first row depicts the dynamic response shown in b. d AWA shows pulsatile activity (blue) in response to a linear gradient of diacetyl. Shown is a sample trace of a single animal. The system outputs accurate smooth gradients, as evident by the excellent agreement between the measured (red) and the modeled (black) concentrations. e AWA pulsatile activity is observed for various linear gradients; top, response to a linear gradient with a slope of 20 µM/min (N = 7 animals); bottom, response to a 10-fold shallower linear gradient of 2 µM/min (N = 8 animals). The first row depicts the dynamic response shown in d. f, g Individuality in pulsatile responses. f Extracting pulse parameters from AWA activity (blue) in response to a linear gradient (red). Exemplary pulses are marked by a colored line on top. To each of the marked pulses, we fit an exponential decaying function in the form: (bottom, colored line), from which we extracted pulse amplitude and decay time. Pulses are ordered sequentially and the line color matches the line color above the activity trace. g Exponentially decaying pulses of six different worms (each denoted by a different color or shape) are plotted in the amplitude and decay time space. Pulses originating from the same animal were significantly more similar than pulses measured from other animals (p < 10–6, bootstrap, see methods). The eleven pulses extracted from f are marked by blue triangles

