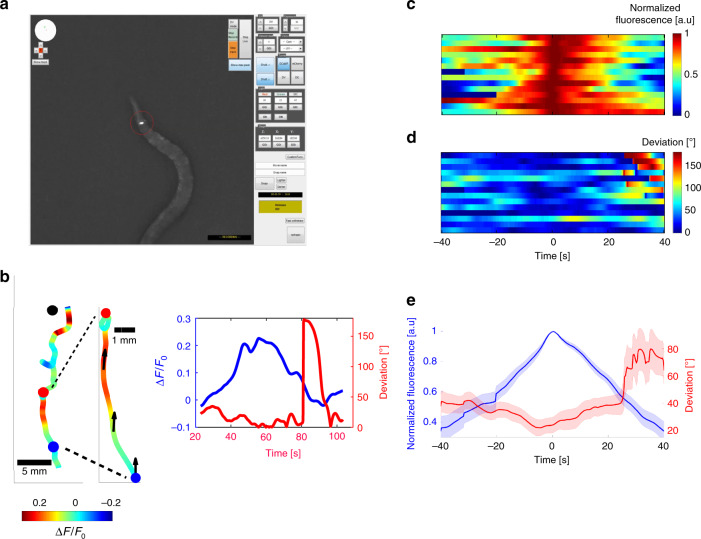
Fig. 2.
The pulsatile activity dictates behavioral outputs. a We developed an automated tracking system that enables tracking of worm movement while simultaneously measuring neural activity from a single neuron. Shown is a screenshot taken from the system as it tracked animal trajectory and AWA activity (red circle) during chemotaxis. b Left part is an example of a worm trajectory from its starting position to the target (diacetyl spot, black dot). The color code represents neural activity levels. In the middle, the trajectory zoom-in demonstrates a single pulse in which activity rose and dropped even when the animal was well directed toward the target (indicated by black arrows). This recapitulates the data observed using the microfluidic device, where activity increased and decreased despite continuously increasing gradients. Right graph extracts from the zoomed trajectory the fold-change activity in AWA (blue) and the angular deviation (red) between the velocity vector and the direct path to the target (as denoted by black arrows on the trajectory). Small deviations indicate that the worm is well oriented toward the target, and ~180° deviation indicates a movement in the opposite direction. An abrupt increase in deviation indicates a reversal event. This demonstrates that animals reverse after AWA crosses peak activity, during the decreasing phase of the pulse. c AWA activity measured from freely-chemotaxing worms (N = 14). The first pulse of AWA was aligned to the point of maximal activity. The first trace belongs to the worm plotted in b. d The angular deviation corresponding to the neural activation shown in c. All reversal events appeared after AWA crossed its peak activity, suggesting it is the decrease in AWA activity that promotes turns, and not vice versa. Maximal deviation is significantly higher in the second half of the pulse, during its decreasing phase (Wilcoxon rank-sum test, p = 0.0035). e Mean normalized intensity (blue) and angular deviation (red) of the 14 worms in c, d. Shaded colors mark the standard errors

