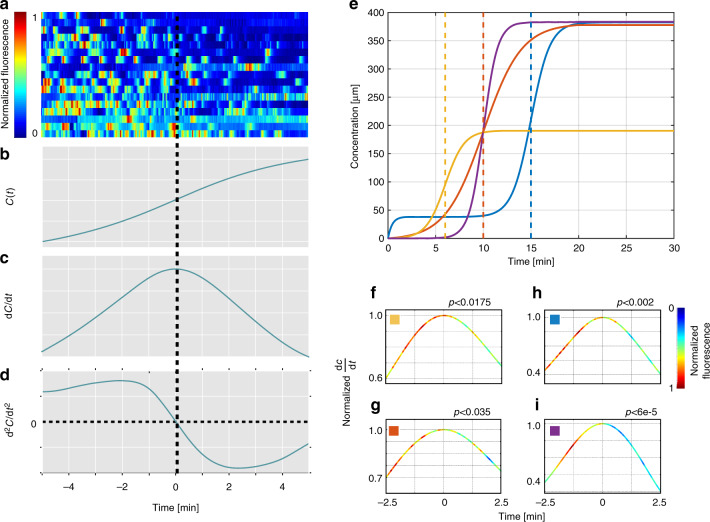
Fig. 3.
Worms adapt to the magnitude of the first derivative. a AWA neural responses in response to a sigmoidal gradient (N = 17). Responses are aligned to: b concentration (a hyperbolic tangent function); c first derivative, and d the second derivative of the concentration. Worms adapted to the levels of the first derivative, and thus, neural activity dropped asymmetrically after the first derivative peaked and the second derivative flipped signs from positive to negative. e Activity decrease after crossing the maximal first derivative point was due neither to the prolonged exposure to the stimulus nor to the stimulus concentration. To eliminate those possibilities, we shifted the stimulus function in time, and changed its absolute concentration. The blue curve is the sigmoid function shown in a–d. The red curve was shifted back by 5 min, such that the peak of the first derivative was reached after 10 min; the orange curve was shifted back by 9 min and reached absolute levels that were two-fold lower. The purple and the red curves reach the peak of the first derivative exactly at the same time; however, the gradient of the purple curve is two-fold steeper at the midpoint. f–i The mean neural activity for the sigmoid functions shown in e. The curve shows the gradient first derivative and the neural activity is color coded. In all cases, neural activity was significantly higher during the first half of the gradient, before the first derivative reached its maximal level (and where the second derivative was still positive) than during the second half, after the first derivative crossed its maximal level (and where the second derivative became negative); f p < 0.02, N = 21; g p < 0.04, N = 12; h p < 0.002, N = 17; i p < 10-4, N = 15 (Wilcoxon signed-rank test)

