Fig. 1.

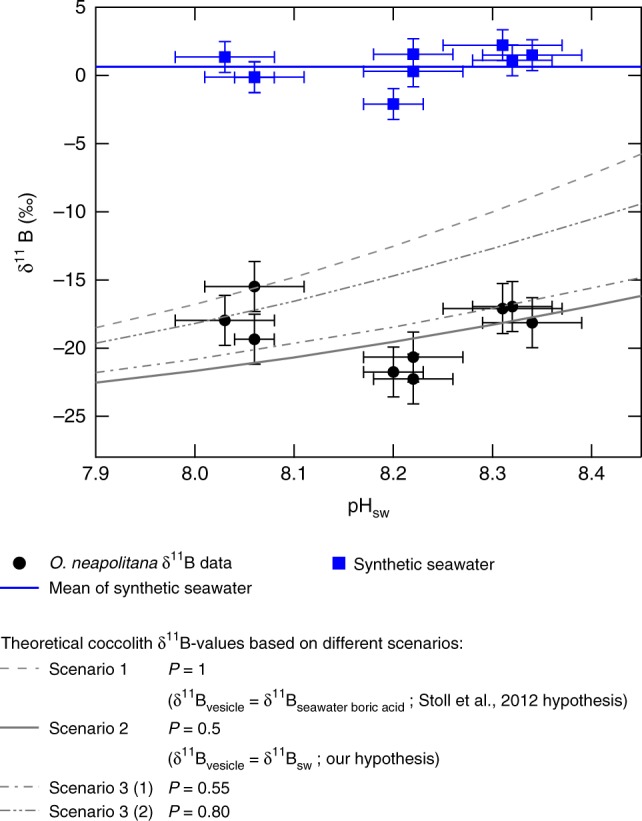
Impact of transporting different boron species to calcification site on coccolith boron isotopic composition. The relationship between δ11B and pHSW for three B-transport scenarios (gray dash line, gray solid line, gray dash-dot line, and gray dash-double dots line for scenarios 1, 2, 3(1), and 3(2), respectively) are compared to δ11B-pHSW relationships for coccoliths from the present study (solid black circles). The B-transport scenarios were calculated relative to average δ11B of culture seawater (blue line is average δ11B of culture seawater across treatments). P is defined as the proportion of total boron entering the calcifying vesicle as boric acid. Individual culture seawater δ11B results are shown as solid blue squares. Although the different B-transport scenarios assume different proportions of seawater boric acid and borate are transported to the coccolith calcifying vesicle, all scenarios assume that the B species will be redistributed in the vesicle pursuant to vesicle pH. The models also assume that only borate ion is incorporated into the coccolith calcite. Scenario 2, boric acid and borate enter calcifying vesicle in proportions that exist in seawater, such that δ11Bvesicle = 11Bsw, best describes the δ11B-pHSW relationships for coccoliths from the present study (gray solid line). Deviations from the scenario 2 curve occur under the most acidified treatment, which may reflect biological elevation of pH at the site of calcification. Error bars are 2 SD for y-axis and 1 SD for x-axis. See detailed calculation in Supplementary Note 1
