Fig. 5.
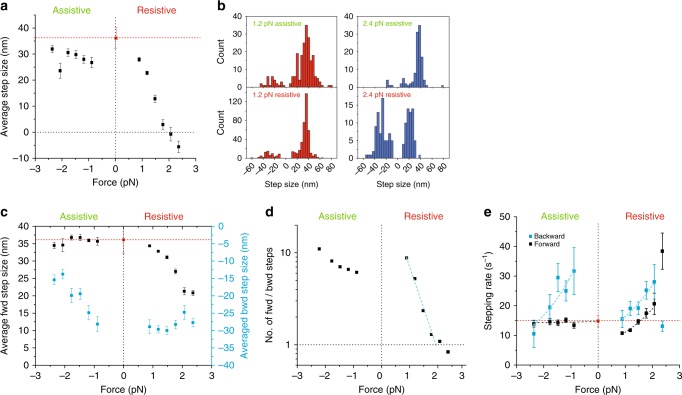
The ratio of forward to backward steps determines myosin-5B run length and velocity under resistive load. a Force dependence of the average step size. Box plot in Supplementary Fig. 1c. b Step size distributions at ±1.2 pN (left panel) and ±2.4 pN (right panel). For resistive forces close to the stall force (+2.4 pN), the distributions of forward (>0) and backward (<0) steps become nearly symmetric. c Force dependence of the average forward (black squares) and backward (cyan squares) step size. d Force dependence of the ratio of forward to backward steps. The dotted cyan line is the fit of the exponential model equation to data for positive forces below the stall force, which gives R0+ = 54 ± 8 and dfwd/bwd+ = 8.2 ± 0.6 nm. e Force dependence of forward (black squares) and backward (cyan squares) stepping rates. Exponential fits of forward (f) and backward (b) stepping rates for positive (+) and negative (−) forces gave: = 6.5 ± 0.6 s−1, = 2.2 ± 0.3 nm; = 10 ± 2 s−1, = 2.0 ± 0.4 nm. = 14.6 ± 0.8 s−1, = 0.05 ± 0.15 nm; = 54.1 ± 17.5 s−1; = 2.4 ± 0.9 nm. Error bars, s.e.m., nfwd = 2729, nbwd = 689. [ATP] = 100 μM. Red squares and dotted lines in a–c and e are, respectively, the unloaded step size and stepping rate measured with the single molecule motility assay at [ATP] = 100 μM (n = 42)

