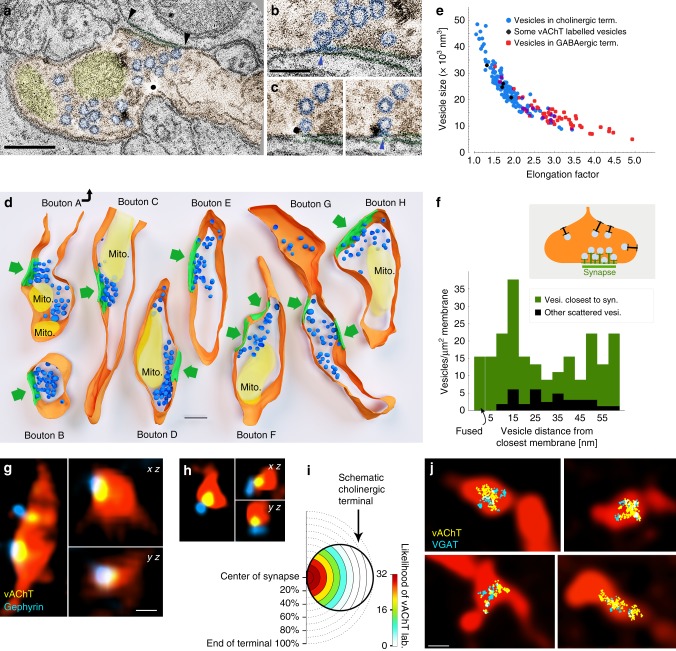
Fig. 4.
Separate vesicular release of acetylcholine and GABA from the same synaptic active zones. a–c About 0.5 nm-thick virtual sections from electron tomographic reconstructions of cholinergic terminals. Terminal is orange, mitochondria are yellow, synaptic vesicles are blue. Black arrowheads point to the edges of the synapse. Scale bar is 200 nm. b Active zone is enlarged from a. The omega-shaped vesicle is being fused with the terminal membrane (blue arrowhead). c Two serial virtual sections showing a portion of the active zone of another terminal. A fused synaptic vesicle (blue arrowhead) is labelled for vesicular acetylcholine transporter (black immunogold particle). Scale bar for b and c is 100 nm. d Three-dimensional models of reconstructed terminals. Terminal membranes are orange, mitochondria are yellow, synaptic vesicles are blue and synapses are green. Green arrows point to the synapses. Scale bar is 200 nm. The association of the vesicle pools to the active zones is evident. e Scatterplot shows the relationship of vesicle size (volume) and elongation factor in the sampled vesicles. Vesicles in the cholinergic terminals had a broader size-distribution than vesicles of purely GABAergic terminals, which were smaller and more elongated (Supplementary Note 4). Some vesicles (black markers) could be identified as vAChT-positive because immunogold particles clearly labelled them. f The density of the vesicles within a 60-nm-wide band from the membrane is plotted as a function of distance from the terminal membrane at synaptic (green) and extra-synaptic (black) areas. Vesicle density was 6.5 times higher (in the first 60 nm from the membrane) in the synaptic active zone than extrasynaptically (n = 183 vesicles from 8 terminals in 2 mice). Docked (closer to the membrane than 5 nm) or fused (undergoing exocytotic fusion) vesicles were absent extrasynaptically, but were present in the active zones. g, h vAChT labelling was confined to synaptic active zones in cholinergic fibres. CLSM images show terminals of virus-traced septo-hippocampal fibres (red pseudocolor) containing vAChT-positive vesicle pools (yellow), localised to the synaptic active zones that are identified by gephyrin labelling (blue). Scale bar is 500 nm for g and h. i Scale-free analysis confirms that the likelihood of vAChT labelling is the highest at the synaptic active zones (n = 32 synapses, 2 mice). j Correlated CLSM-STORM super-resolution microscopy images show that vAChT (yellow) and vGAT (cyan) vesicle pools are overlapping and are confined to small portions within AAV-eYFP virus-traced septo-hippocampal fibres (red pseudocolor)

