Fig. 6.
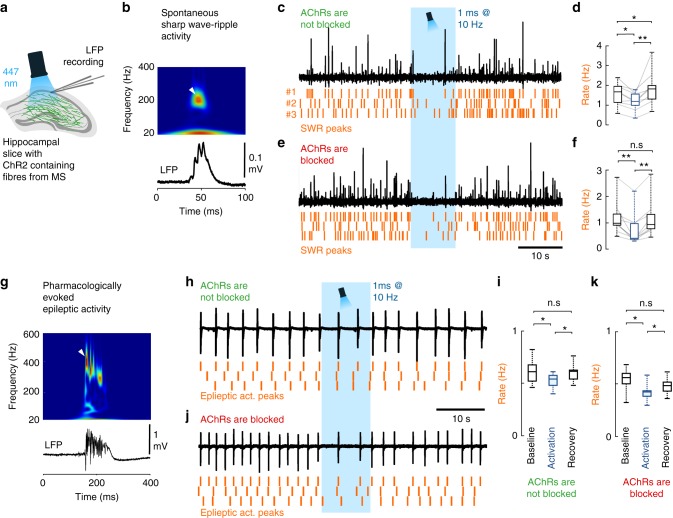
GABA release from cholinergic terminals controls healthy and pathological hippocampal network activity. a To understand the functional impact of GABA and acetylcholine co-transmission onto cortical network oscillations, local field potential (LFP) was recorded with standard patch pipettes from the CA1 area of thick hippocampal slices. These slices generated healthy and pathological in vivo like activity patterns. Cholinergic fibres expressing ChR2 were illuminated with blue light in the presence, or in the absence of AChR blockers parallel with LFP recordings. b A spontaneous sharp wave-ripple (SWR) LFP signature (bottom), and its wavelet transform (top) highlighting the characteristic ripple-band frequency component (~200 Hz, white arrowhead). c, d LFP recording from hippocampal CA1 in the absence of AChR blockers (n = 9). Orange raster indicate SWR peaks for three consecutive stimulation periods. Optical stimulation decreased SWR rate significantly (d), then SWR rate increased temporarily after the cessation of optical stimulation (median values, interquartile ranges and min/max values, for data see Supplementary Note 8). e, f After we blocked AChRs (1 µM MLA, 1 µM DHβE, 10 µM atropine), LFP recording from CA1 (n = 9) showed that GABA release from cholinergic fibres alone could decrease SWR rate even more effectively (f). There was no SWR rate increase after the cessation of optical stimulation (median values, interquartile ranges and min/max values, for data see Supplementary Note 8). g Epileptiform activity was evoked by elevating K+ concentration in the ACSF to 8.5 mM in slices. LFP (bottom) and its wavelet transform (top) shows the signature of a pharmacologically evoked epileptiform events. Note the robust differences in amplitude, length and frequency components compared to physiological SWR activity (Fig. 6b) that is consistent with literature data41. h, i Epileptic activity recorded in CA1 in the absence of AChR blockers (n = 7). Orange raster indicate detected epileptic activity peaks for three consecutive stimulation periods. Illumination of cholinergic fibres reduced the rate of epileptic events (i), which recovers after the cessation of optical stimulation (for data see Supplementary Note 8). j, k Epileptic activity recorded in CA1 in the presence of AChR blockers (n = 8). Even in the presence of AChR blockers, illumination of cholinergic fibres reduced the rate of epileptic discharges (k), which recovers after the stimulation (median values, interquartile ranges and min/max values, for data see Supplementary Note 8), suggesting a crucial role for GABA release in controlling epileptiform activity

