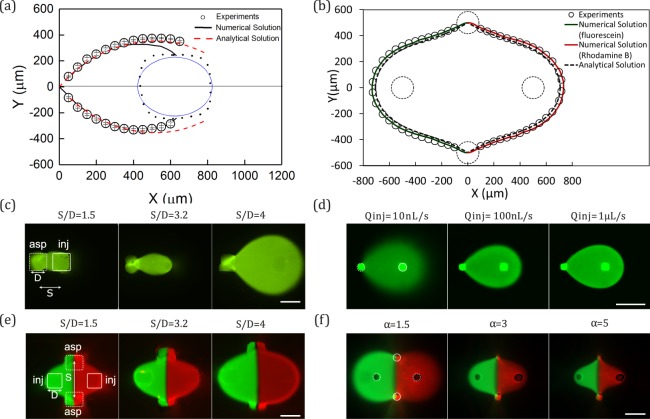
Figure 3.
Characterization of MD and MQ produced by the 3D printed MFPs. (a) Comparison between the experimentally measured, numerical simulation, and analytically calculated flow profiles of the MD using Design 1 MFP. D = 400 µm, α = 3. (b) Comparison between the experimentally measured, the numerical simulation, and analytical flow profiles of the MQ using the Design 2 MFP with fluorescein (left) and rhodamine B (right). D = 180 µm, α = 3. (c) MD profiles produced using the Design 1 MFP as a function of aperture spacing to diameter ratio (S/D). Qinj = 100 nL/s, α = 5. (d) MD profiles of the Design 2 MFP (clear resin MFP coated with black ink) as a function Qinj. S/D = 4.8, α = 3. (e) MQ profiles produced using Design 1 MFP as a function of S/D. Qinj = 100 nL/s, α = 3. (f) MQ profiles produced using Design 2 MFP (gray resin)as a function of α. Qinj = 100 nL/s, S/D = 5.5. All scale bars are 500 µm.

