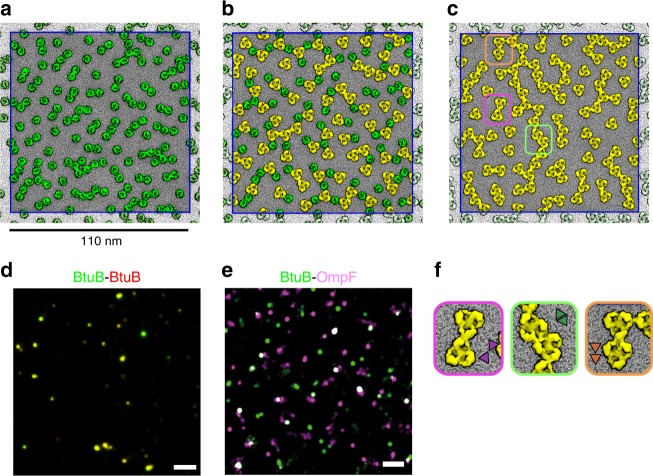
Fig. 1.
Simulations and experimental observations of OMPs compared. Final snapshots of 20 μs molecular simulations of a 144 molecules of BtuB (green); b 72 molecules of BtuB + 72 molecules of OmpF (yellow); and c 100 molecules of OmpF in a lipid bilayer (PE:PG 3:1) membrane and simulated at 323 K. For the OmpF system, the zoomed images (f) illustrate the three main configurations of OmpF association observed in the simulations: tip-to-tip (purple box), base-to-base (green box) and base-to-top (orange box) interactions of adjacent OmpF trimers (see main text and ref. 2). Further simulations demonstrating similar behaviour are shown in Supplementary Fig. 2. Clustering/co-localisation of d BtuB molecules (green and red; overlap in yellow) and of e BtuB (green) and OmpF (purple; overlap in white) molecules in supported bilayers (scale bar = 1 µm). It should be noted that d, e show under-labelled samples (we estimate less than 10% of BtuB molecules are linked to a fluorescent ColE9) in order to enable us to meaningfully distinguish single molecule trajectories

