
Fig. 2.
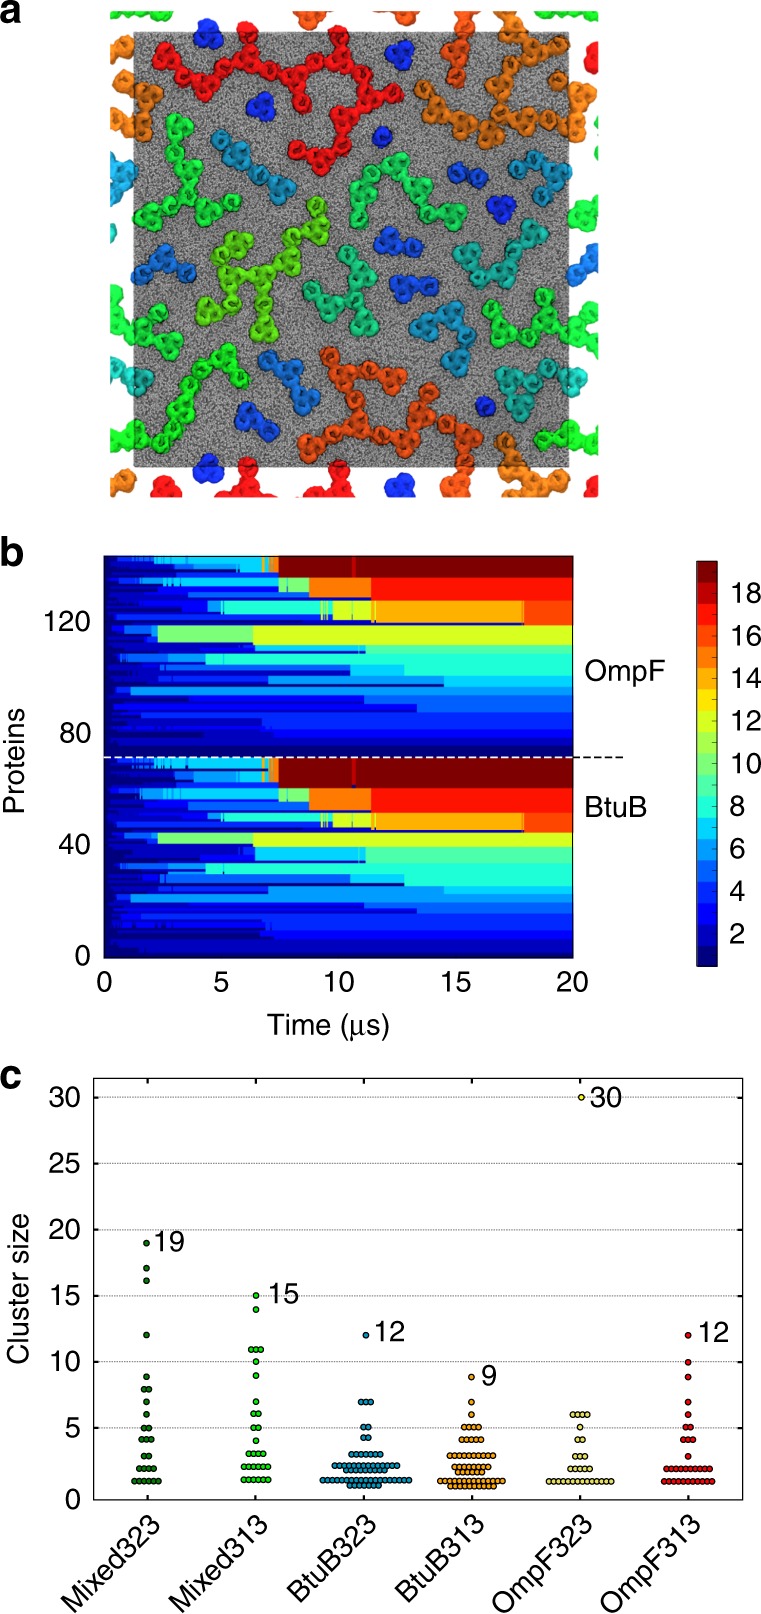
Clustering of OMPs in simulations. a Nanoscale clustering of BtuB and OmpF (Mixed323 simulation—see Table 1) at 20 µs. Proteins are coloured according to cluster membership on a blue (one of two molecules/cluster) to red (>16 molecules/cluster) scale. The colour scale, representing cluster size, is shown on the right side of the panel. b Evolution of cluster sizes over the course of the 20 µs Mixed323 simulation. Each horizonal line represents an individual protein, which is coloured according to cluster size on the same scale as in a. c Distribution of cluster sizes (at 20 µs) for all six simulations (see Table 1 for details, and Supplementary Figure 3 for snapshots and time evolution for all systems)