
Fig. 4.
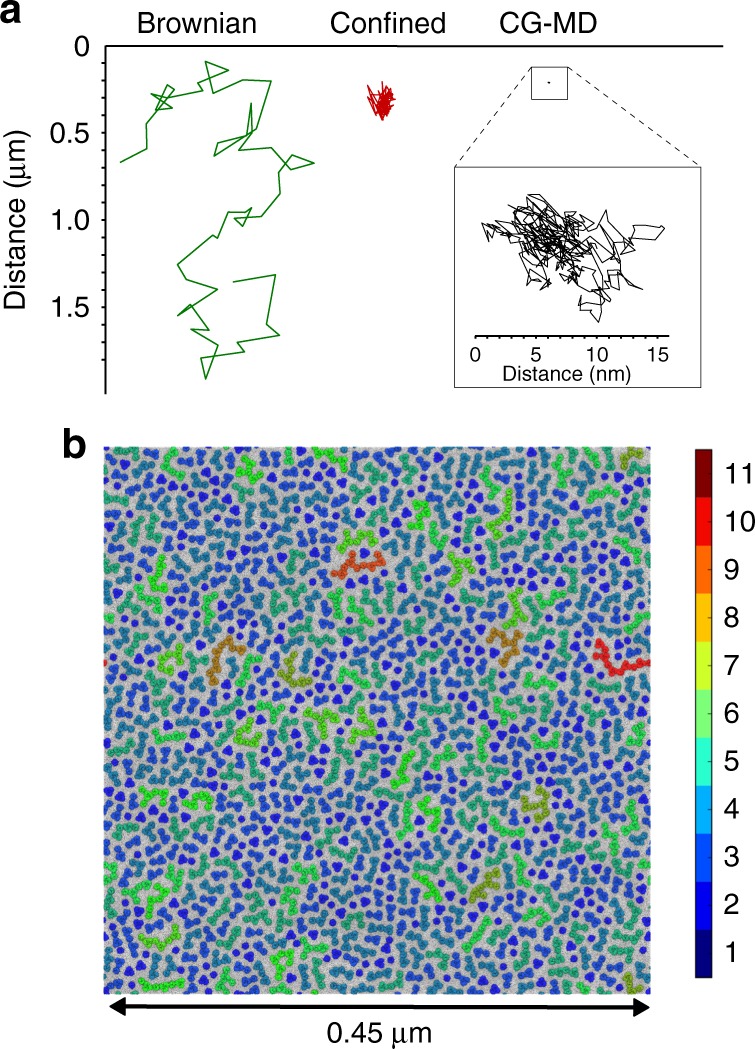
Increasing the spatial extent of CG–MD simulations. a Comparison of the spatial extent of two selected in vitro BtuB trajectories (Brownian, green; confined, red) and of a trajectory (black) selected from the BtuB323 CG–MD simulation. Note that the in vitro trajectories are collected over a timescale of seconds, whereas the CG–MD trajectory encompasses 20 µs. b Snapshot (2.5 µs) from a very large simulation of 1152 BtuB + 1152 OmpF on a length scale (0.5 µm) corresponding to that probed experimentally. The evolution of clustering behaviour is shown in Supplementary Figure 7. This simulation used 350,000 cpu.h per microsecond and generated 1.5 TB of data. The colour scale shows protein cluster size