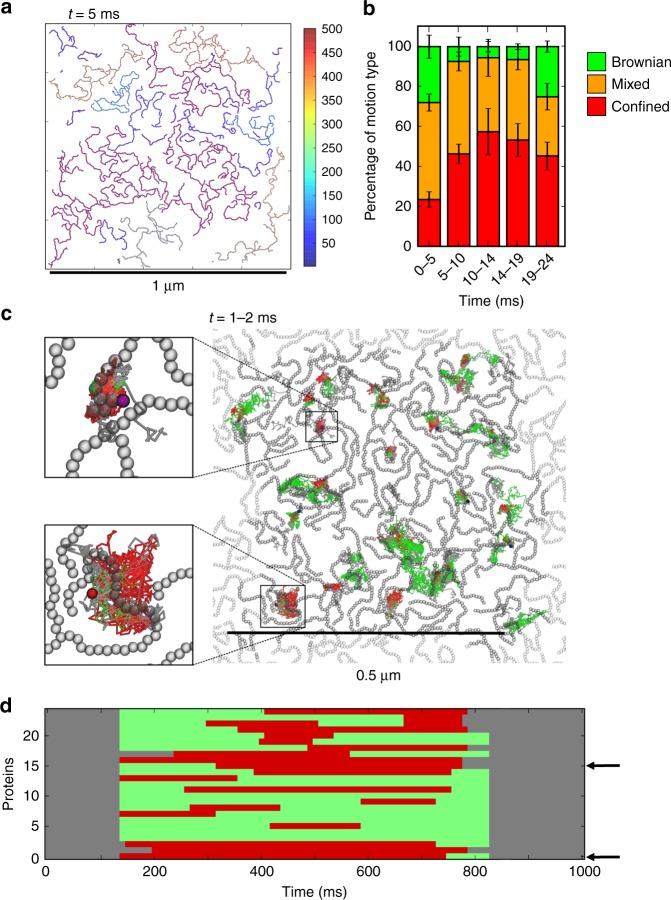
Fig. 7.
Mesoscale simulations at experimental scales. a Snapshot of a 24 ms duration mesoscale simulation of a patch of membrane containing 4900 proteins in a 1 µm2 box at 5 ms. The patch dimensions correspond to those of an experimentally observed OMP island. The colour scale represents protein cluster size. b Fraction of different classes of diffusional motion (Brownian, green; confined, red; or mixed Brownian and confined, orange) for a random sample of 100 from the 4900 proteins in the mesoscale simulation as a function of time. Error bars show the standard deviation given by taking five repeat resamples of 100 proteins. c Tracking over 1 ms of 25 inserted proteins. These were added to the mesoscale simulation in a after 1 ms, which was then allowed to run for a further 1 ms. The traces for the inserted proteins are coloured according to the motion type, as in b. The snapshot is from the final frame (i.e. at 2 ms) with the 2500 original proteins in grey, and their periodic repeats in pale grey. The trajectories of the newly inserted proteins are shown in red (confined) or green (Brownian). The upper inset shows a protein, which becomes part of a larger cluster and displays confined motion whilst the lower inset shows a protein that remains monomeric but exhibits confined motion as a result of being corralled by the pre-existing (in grey) cluster of proteins. d Classification of the diffusional motion of the 25 inserted proteins over the 1 ms simulation following their insertion. Colouring is as in c. (The grey blocks at either end of the trajectories are because the classifications employ a sliding window, and therefore these points are unclassified.) Arrows indicate the two protein trajectories displayed in the insets in c

