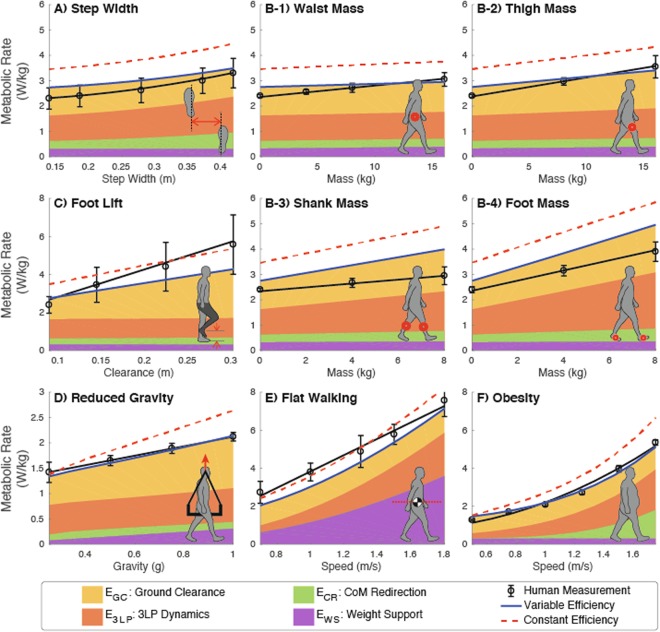
Figure 2.
Comparison of model metabolic rate (red lines) with data from six walking experiments from literature (black circles, solid lines). Model predictions include with variable efficiency (solid blue line) and with constant efficiency (dashed red line). The six comparisons were on (A) step width19, (B) added mass to the leg20, (C) extra foot lift21, (D) simulated reduced gravity22, (E) CoM flat-trajectory walking23, and (F) walking with obesity24. Fitting equations, from the original experiments when possible, were used to investigate trends (see Table S1). Patch layers represent the contribution of each cost component (yellow: ground clearance, orange: 3LP dynamics, green: CoM redirection, purple: weight support).

